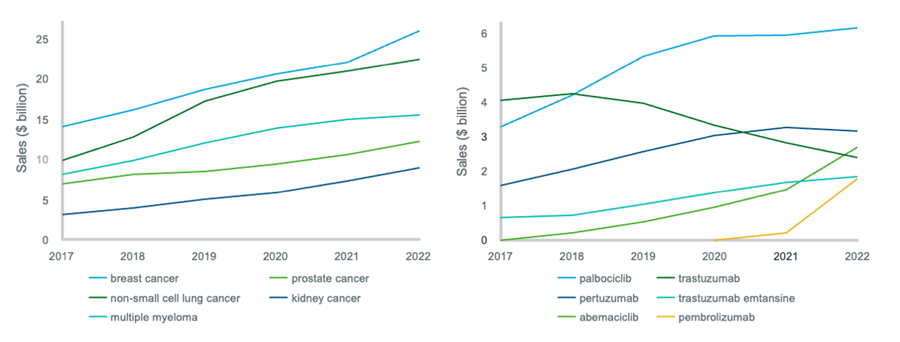
Source: IQVIA MIDAS Disease. Sales are global and ex-manufacturer, calculated using a constant exchange rate. In the first line chart, the value of each cancer is the total value of all its respective products. In the second line chart, the value of each molecule is its value within the breast cancer market only.
The sales of breast cancer therapies are greater than those of any other cancer, worth $26 billion in 2022; breast cancer has maintained this position despite the rise of non-small cell lung cancer (NSCLC) in 2020 and 2021. Within breast cancer, Ibrance (palbociclib) has become the market leader, as shown in Figure 2; meanwhile biosimilars for trastuzumab have entered the market, causing the value of this former market leader to fall.
There are two main products driving absolute growth in the breast cancer market. One of these, Keytruda (pembrolizumab), has already been approved for multiple indications and was notably approved by the FDA for two different forms of triple-negative breast cancer in Q4 2020 and mid-2021. The second driver, Verzenio (abemaciclib), was first approved by the FDA for HR-positive HER2-negative advanced or metastatic breast cancers in 2017 and has since received approval for several other breast cancer indications.
Within the NSCLC market, Keytruda used to be one of two key drivers of absolute growth, and although it remains the clear market leader, its sales have plateaued in recent years. Tagrisso (osimertinib) is now the biggest driver of absolute growth and has the second-largest market share; its sales have been increasing steadily over the last five years, and its 2021-22 year-on-year (YOY) growth rate was 16%.
The value of multiple myeloma has plateaued in the last couple of years, due to recent loss of exclusivity of Velcade (bortezomib), but it remains the indication with the third-largest share of the oncology market.
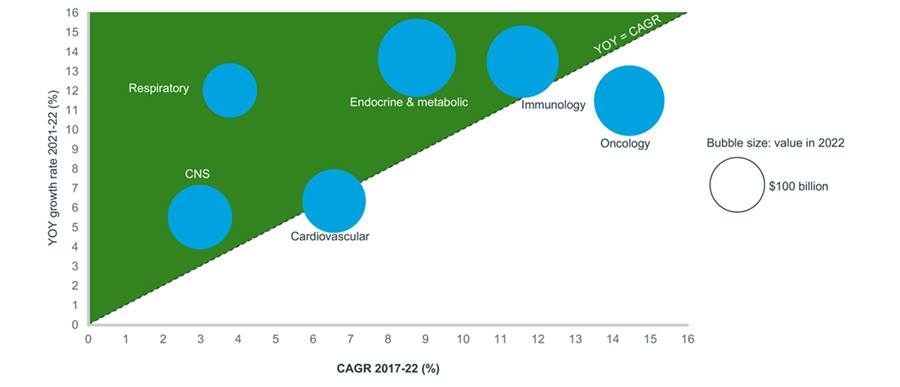
Other indications with a significant share of the oncology market include prostate and kidney cancer, at 7.6% and 5.6% respectively. Keytruda is one of several drugs driving kidney cancer sales, and with a 2021-22 YOY growth rate of 46% within this indication, it became the joint-biggest drug in kidney cancer in 2022 alongside Opdivo (nivolumab). Liver cancer and bladder cancer are two of the indications within oncology with the greatest growth rates; they had 2021-22 YOY growth rates of 32% and 34% respectively, and even higher 5-year CAGRs of 49% and 36%.
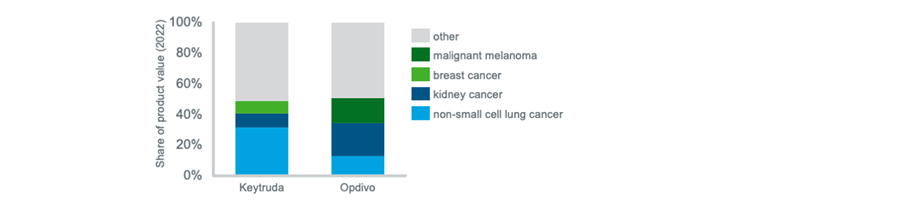
Figure 2 illustrates the split of the sales of two checkpoint inhibitors across their respective top three indications. Over 30% of Keytruda’s value comes from the NSCLC market, followed by several other cancers each with less than 10% of its total value, including kidney cancer. By contrast, Opdivo sales are split more equally across the top three indications, the leader of which is kidney cancer at 22%.
The next article will explore similar trends and insights in the immunology and respiratory markets.
To access additional resources about MIDAS Disease, such as fact sheets, on-demand webinar, blog articles and to inquire about a demo, please click here.