














Market Access
Gain high value access and increase the profitability of your brands
Analysis of a representative sample of small molecule and biologic launches from 2005-2012 demonstrated that:
2026 marks the first initial price applicability year of the Medicare Drug Price Negotiation Program (MDPNP), with 10 selected drugs now facing government-set discounts in Part D. An additional 15 Part D drugs were selected for 2027 applicability, as well as another 15 Part D and Part B drugs for 2028. However, the MDPNP is not the only program directly setting drug prices in today’s policy landscape. The Trump administration’s Global Benchmark for Efficient Drug Pricing (GLOBE) and Guarding U.S. Medicare Against Rising Drug Costs (GUARD) proposed demonstrations would rely on international prices to determine mandatory rebates for a substantial portion of drugs utilized by Medicare patients.
In a previous blog, IQVIA published data showing the impact of the MDPNP on small molecule brands, which are subject to earlier selection for the MDPNP than their biologic counterparts. This blog expands the investigation to include biologic brands that launched between 2005 and 2012 and tracked those brands for the first 13 years post-launch. The included biologic therapies represent approximately 30% of biologic launches during the launch period and capture approximately 80% of biologic sales from 2012 through 2025.
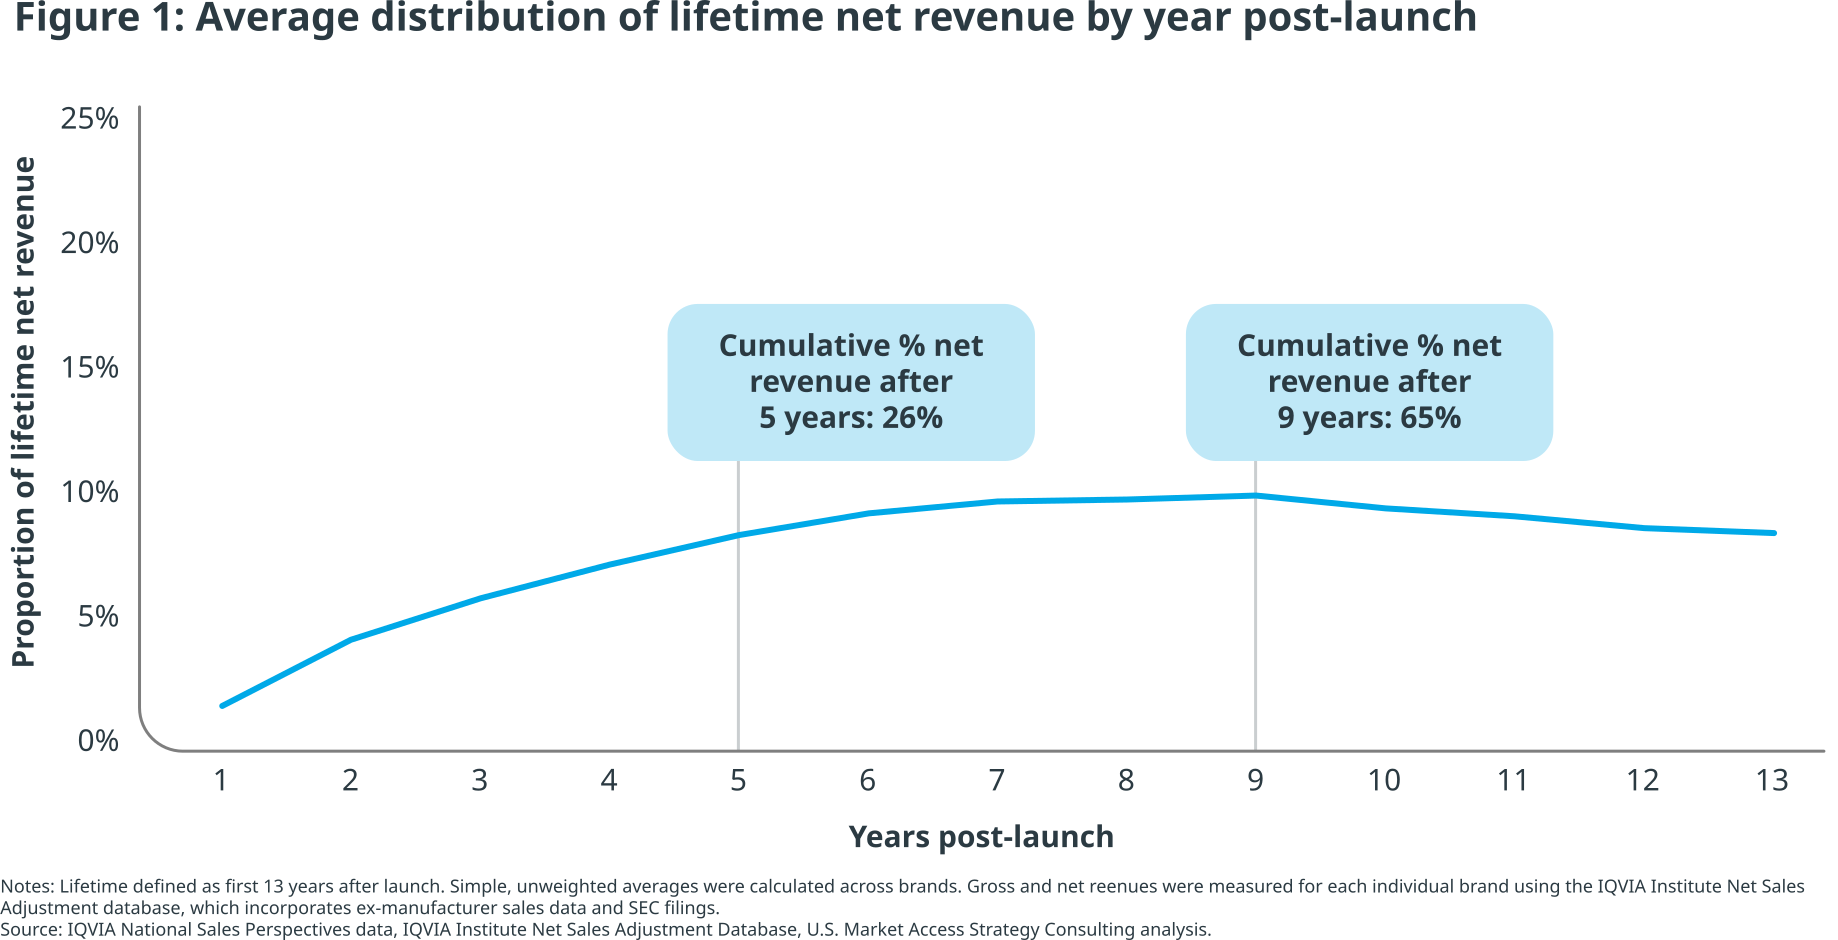
Over the course of a brand medicine’s average lifespan, revenues generated at list price (gross revenue) and after discounts (net revenue) tend to increase as the brand matures. Across all 100+ products studied, brands earned 24% of lifetime (measured over the first 13 years on market for the purposes of this study) gross revenue and 26% of net in the first five years. In the first nine years, the proportion of lifetime gross and net revenue increased to 62% and 65%, respectively. This means that a third of total revenue is generated after a medicine has already been on the market for nine years. The average proportion of overall revenue plateaus, and may even decrease, over time.
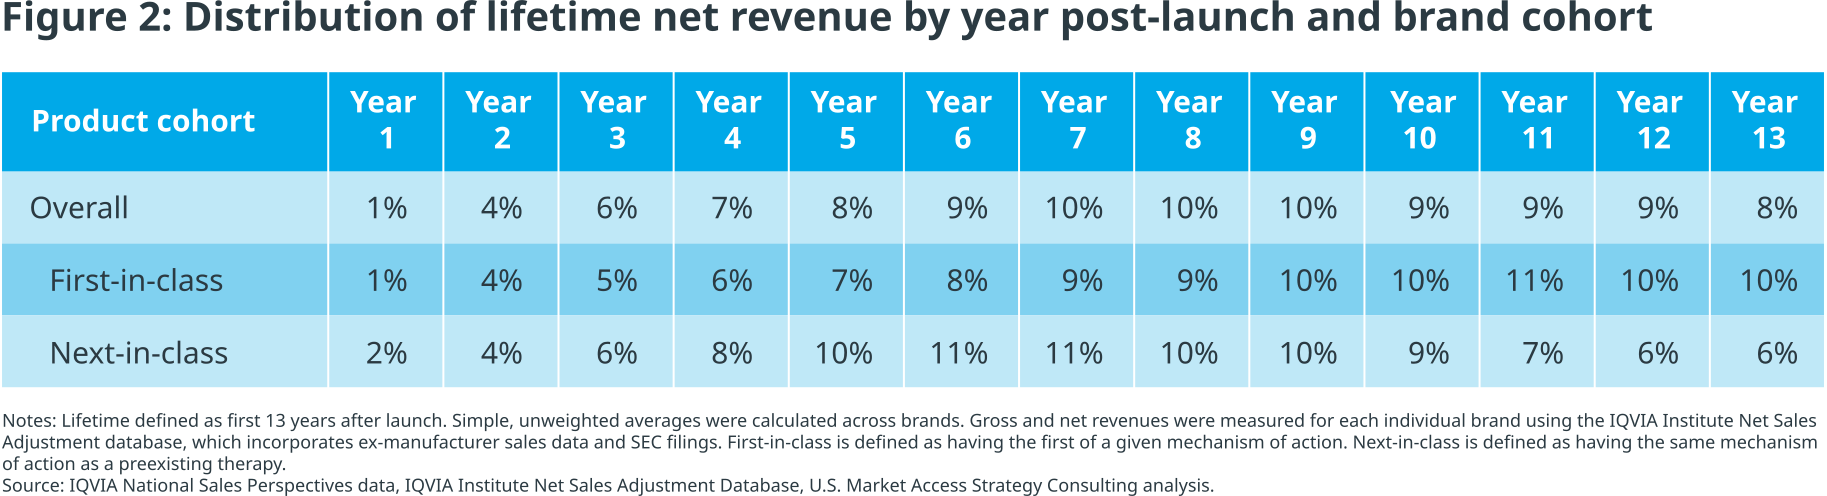
First-in-class drugs introduce new mechanisms of action to an existing therapeutic area or treat a new condition altogether. In terms of lifetime net revenue, first-in-class brands are more backloaded than the next-in-class brands that follow them. The slower start is partly driven by slower adoption as these medicines have yet to become standards of care.
Next-in-class therapies offer patients even more options and launch in a more established market, allowing for faster adoption and a greater proportion of lifetime net revenue in earlier years post-launch. Where first-in-class brands only earn 23% of net revenue after five years post-launch, next-in-class brands earn 30%. After nine years post launch, the difference widens to 59% and 72%, respectively.
The discussion around U.S. drug prices continues to evolve, and it is uncertain where policymakers will land. Whether there will be more price-setting legislation remains to be seen, making it necessary to understand when and how revenue is realized across a medicine’s lifecycle. The later-years’ concentration of revenue across branded drugs suggests that pricing policy changes implemented during a drug’s lifecycle may have effects that extend beyond pricing alone. They may also influence development priorities, indication strategy, and the long-term incentives that support future innovation.
Pricing reforms can shorten the window in which manufacturers are able to earn revenues anticipated by investors and shareholders during what would otherwise be the patent-protected exclusivity period. That has implications not only for individual products but also for the economics of innovation more broadly. Drug development remains expensive and risky, with only a subset of products making it to market. Therefore, long-term innovation decisions can be sensitive to changes in expected revenue timing, requiring difficult trade-offs to be made as clinical strategy is compressed.
Against that backdrop, more expansive price setting policies applied to more drugs or earlier in the lifecycle may shift development and launch strategy towards therapies that are anticipated to generate value earlier (e.g., larger indication or delayed launch). One implication may be fewer new uses pursued over time. Another may be greater selectivity in investment decisions, concentrating investment on therapies and indications with the least exposure to pricing pressure, and thereby inadvertently incentivizing which patient populations receive the next breakthrough. Over time, that could affect not only how products are researched, developed, priced, and commercialized, but which areas of future health progress receive attention and which do not.
This blog and the annual proportion of sales analyses were sponsored by the Pharmaceutical Research and Manufacturers of America (PhRMA). The findings and points of view are the result of IQVIA’s investigation and expertise.
The authors would like to thank Catie Kollath, Nikitha Lakshminarayanan, and Byron Lind for their contributions to this blog.

Does lower drug pricing automatically lead to better patient access? Read this analysis to uncover why rejection rates remain stubbornly high despite Medicare's new pricing provisions and what the data reveals about the continued impact of payer controls on patient access.
Gain high value access and increase the profitability of your brands
Data, AI, and expertise empower Commercial Solutions to optimize strategy, accelerate market access, and maximize brand performance.