


Subscribe
IQVIA Blog Digest
For all the latest industry insights, please subscribe to the IQVIA U.S. blog digest.
For manufacturers of specialty products, patient data is a critical pillar of success. A positive patient experience means everything, not only to the success of the product, but for organizational culture as well. The value of removing patient impediments to therapy is very important, and IQVIA offers helpful solutions.
This two-part blog series focuses on a recent session from the virtual Fusion 2021 Connected Intelligence conference and how IQVIA is collaborating with clients to connect and leverage data through ValueTrak, a cloud-based data management tool that processes and analyzes channel and prescription data. This blog also dives into how user interface and backend enhancements assist clients with integrating business-critical data into third-party and internal systems.
This blog highlights how enhancements to the program and the use of more detailed patient information, combined with visualization techniques, artificial intelligence (AI), and machine learning (ML), is helping to maximize adherence for the patient and gross-to-net outcomes for the manufacturer.
We have found that many ValueTrak users prefer to have metrics served up directly due to the value the data has when obtained, analyzed, and utilized as soon as possible. For these users, the introduction of one-click, Tableau-driven visualizations has proven invaluable, as having direct access allows clients to spend more time analyzing the data and take action based on findings.
Additional benefits to ValueTrak include:
Overall, IQVIA understands the need to move towards guided analytics, an evolving industry concept that is now considered a best practice and takes a less-is-more approach. The most efficient dashboard, with this mindset, is one that minimizes the amount of data displayed at any one time, so instead, minimalist, high-level information is displayed. Users are then guided visually to the next logical level of data.
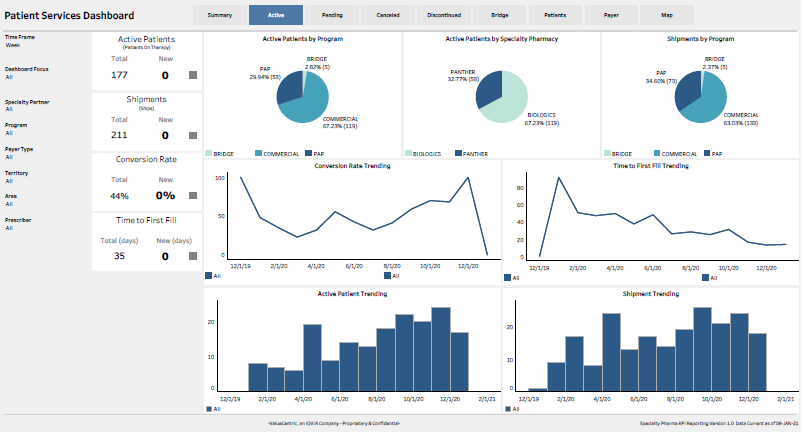
Speaking visually from a patient data perspective, our suite of patient access dashboards, including pre-built dashboards that leverage status and sub status information based on specialty, pharmacy, and hub, can identify patients who are struggling to get on therapy and answer questions as to why that is the case. These dashboards offer high-level metrics for active patients and address questions such as how many patients are actively receiving product, whether the product is growing, and how long it’s taking to achieve the first fill. In the case of pending patients, the data can identify the key reasons for the pending status. For those who are seeing discontinued activities or cancellations, the data can reveal how many patients are not starting therapy, or those who are beginning therapy but ending early (and why). Addressing additional questions about key drivers for patients utilizing non-commercial programs, which segments of patients are facing prior authorization barriers, and identifying regional or territory account-level performance is also achievable.
Going a step further, we’ve also invested heavily in the roadmap to leverage AI/ML to identify at-risk patient cohorts and whether there could be multiple factors contributing to non-adherence. This allows manufacturers to take intelligent action to connect with these patients to determine next steps to help them begin and remain on therapy.
Self-serving analytics has become a best practice and has resulted in manufacturers gaining access to improved data and technology. Data storage and processing power is becoming much more affordable, as are business intelligence tools. Access to training or affordable resources is also vastly improved, and this all leads to an increased desire by manufacturers to bring certain analytics functions in-house. IQVIA has invested in new capabilities in support of these trends.
Enhancements include flexibility of data integration, as well as easier integration abilities to combine new internal and external datasets. Adjustments to inbound and outbound delivery of data through extracts and scheduled reports have been made, and new companion tools that provide quality control monitoring and alerting of data contained in exports have been added in an effort to flag any potential issues with data prior to delivery. This ease of comparison across disparate datasets is another example of intelligent connections in ValueTrak.
Another important factor for us in building the platform in response to customer utilization trends has been visualizing profitability by state or territory. Allowing for that level of flexibility at different geographies is an important component of the service and the corresponding analytics.
Manufacturers have also had increased use of their data being managed in ValueTrak for gross-to-net monitoring and related analytics to maximize profitability. For these reasons, we continue to make investments towards a platform for measuring gross-to-net that allows access to strategic insights and guides towards solutions strategies to maximize profitability. To that end, IQVIA is able to analyze all factors that are removed from gross price to determine net price, at any level, such as breaking out rebates and discounts, co-pay spending, and drug safety associate fees. Being able to create that traditional waterfall diagram helps to analyze profitability. Through available market access libraries based on patient and claims data, insights can actually be granular down to profitability per transaction.
This second blog installment highlights how IQVIA’s concept of intelligent connections can take your data to the next level and provide deeper, smarter insights. We dug in deeper to this topic at the recent Fusion 2021 conference; if you missed this year’s sessions, click here to watch them on demand!
This series of on-demand videos will show you how making better data connections can uncover new opportunities with greater insights so that you can make more informed, confident decisions spanning: