


- Insights
- The IQVIA Institute
- Reports and Publications
- Reports
- Orphan Drugs in the United States: Growth Trends in Rare Disease Treatments
About the Report
Rare diseases have increasingly been discussed in the media over the past several years as the number of new treatments has surged. Many of these diseases are life-threatening or life-limiting, and while some conditions can now be treated and managed as chronic conditions, for the first-time new curative treatments are bringing the prospect of a better life to patients. This report updates an analysis of the Orphan Drug market published by the Institute in October 2017 and provides a historical perspective on the characteristics of rare diseases, their treatments and the role of the Orphan Drug Act of 1983 in advancing rare disease medicines. It describes the characteristics of orphan drug spending, volumes and prices, placing orphan drugs in the context of specialty drug trends and overall medicine spending levels and growth.
Report Summary
Many rare diseases remain without effective treatments despite over 500 orphan drug therapies having been approved in the United States. However, a growing focus by researchers and the FDA on rare disease therapies have resulted in a dramatic increase in the number of new therapeutic options for these patients over the past two years. In 2017, the FDA approved 80 orphan indications and in 2018, it approved 57 in the first eight months of the year. The combination of scientific advances, along with a growing commitment by policy makers to advance precision medicine, is fueling the increased number of orphan therapies.
Orphan drugs can be expensive for patients and payers. However, there is generally an inverse relationship between the price of these therapies and their volume of use, given that orphan drugs are developed for small patient populations. Although the median annual cost for an orphan drug in 2017 was over $46,800, the median annual cost for the top ten rare disease therapies used by the greatest number of patients was much lower at $1,216. Overall, drug spending in the United States is evolving from an emphasis on high-volume, low-cost drugs for chronic diseases toward drugs with lower volumes but with higher value in terms of patient outcomes.
The orphan drug share of the total volume of pharmaceuticals used in the United States declined from a peak of 0.6% in 2003 to 0.3% in 2015 but has risen to 0.4% by 2017. Total drug spending in the United States in 2017 was $451 billion, with almost 56% spent on non-orphan traditional drugs, 34.7% spent on non-orphan specialty drugs and 9.6% spent on orphan indications of approved orphan drugs. Spending on orphan indications has increased moderately and these drugs represent only a small part of the overall medicine budget.
Key Findings
Since the passage of the Orphan Drug Act, the number of orphan indications approved in the United States has risen dramatically
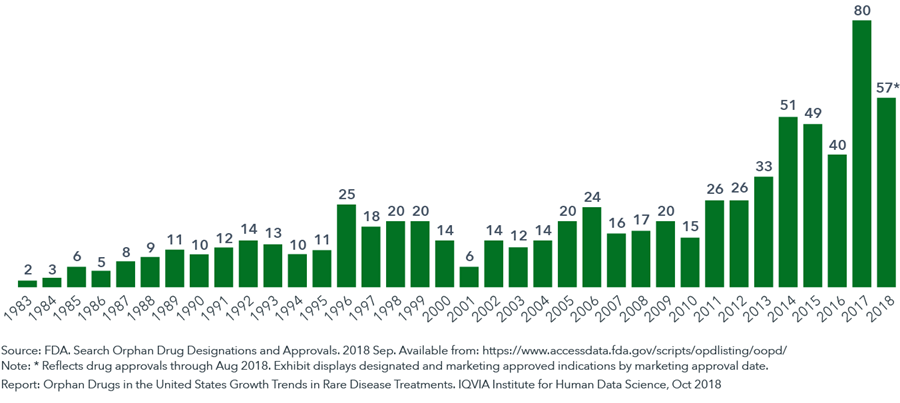
- The FDA approved 80 new orphan indications in 2017 and 57 just within the first eight months of 2018, the highest numbers annually since the passage of the Orphan Drug Act.
- The FDA granted orphan designations to over 429 unique drugs under development in 2017.
- Drug manufacturers continue to increase their focus on the development of therapies for orphan indications and half of the 42 new active substances (molecules not previously approved as a medicinal product) launched in the United States in 2017 were orphan drugs.
Orphan drugs that are used to treat small populations are often more expensive than orphan drugs used for larger populations
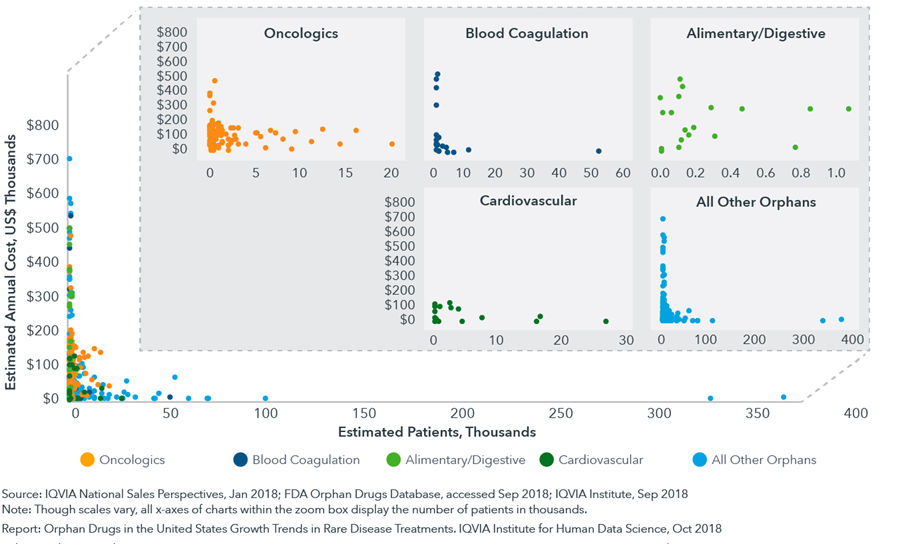
- An inverse relationship exists between the cost per year for a therapy and the number of patients, with more expensive therapies being dispensed to relatively few patients.
- The median annual cost for an orphan drug in 2017 was over $46,800 per year.
- However, the ten orphan therapies used by the greatest number of patients averaged $9,676 per year (the median cost was $1,216).
Medicine spending in the United States is shifting from traditional small molecule drugs towards specialty medicines that treat relatively few people with chronic, complex or rare diseases
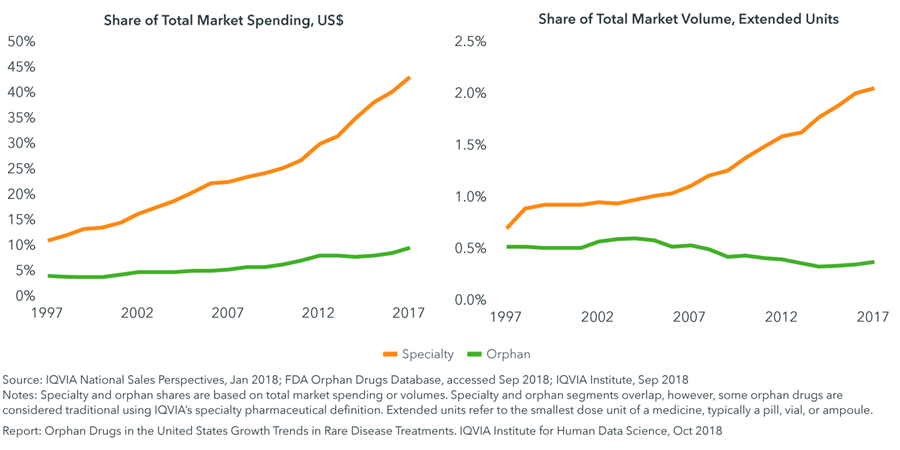
- Specialty share of total medicine spending has risen from 11% in 1997 to 43% in 2017, while spending on orphan drugs has risen from 4% to 10% during the same period.
- Many orphan drugs are specialty products, and 87% of orphan spending falls within specialty.
- The evolution of drug spending has been accompanied by cost-saving mechanisms introduced by healthcare stakeholders including: specialty tiers in health plans, patient co-insurance payments, use of specialty pharmacies and limited distribution networks, among others, that increase the cost burden on patients.
Although a quarter of all drug spending in the United States is tied to drugs with orphan approvals, only 9.6% of their use is for orphan designated indications
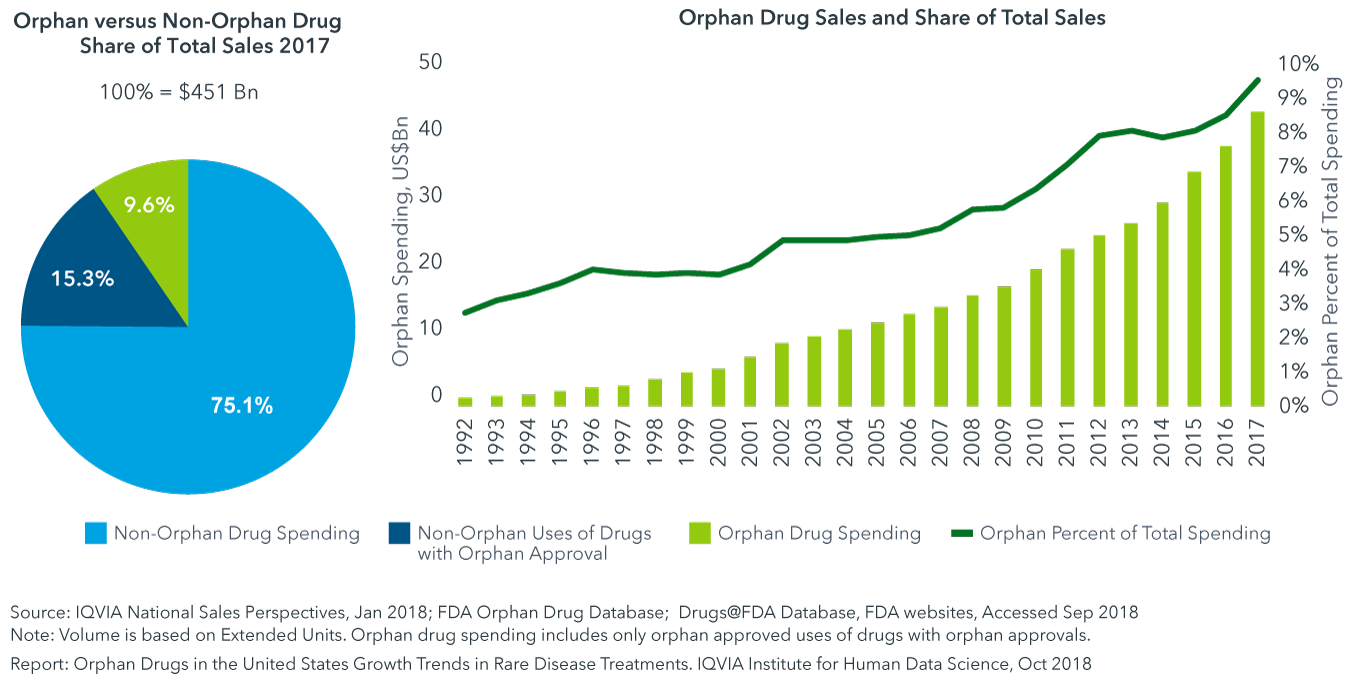
- While the number of approved orphan drugs increased from 364 in 2013 to 487 in 2017, the share of total drug spending tied to orphan indication use increased from 8.1% to 9.6%, up from about 3% in 1993.
- Non-orphan use of these molecules represents 15.3% of overall medicines spending, reflecting that for those molecules with both orphan and non-orphan indications, the non-orphan indications represent much of their use and sales.
- Use of orphan drugs for their approved orphan indications account for approximately $43 billion.