


The third and penultimate article in this series will investigate global sales dynamics at the disease level in the endocrine & metabolic, cardiovascular, and central nervous system (CNS) therapy areas using MIDAS Disease insights.
Diabetes dominates the endocrine & metabolic market, but obesity has a far greater YOY growth rate
Diabetes dominates the endocrine & metabolic therapy area by value, and its growth is accelerating, with a 2021-22 year-on-year (YOY) value growth rate of 14%. This growth is being driven by five molecules, all of which are for type 2 diabetes. Four of these molecules are shown in Figure 1, along with the former market leader, insulin glargine.
Figure 1: trends in value of 4 selected endocrine & metabolic indications; sales of 5 key drugs for diabetes
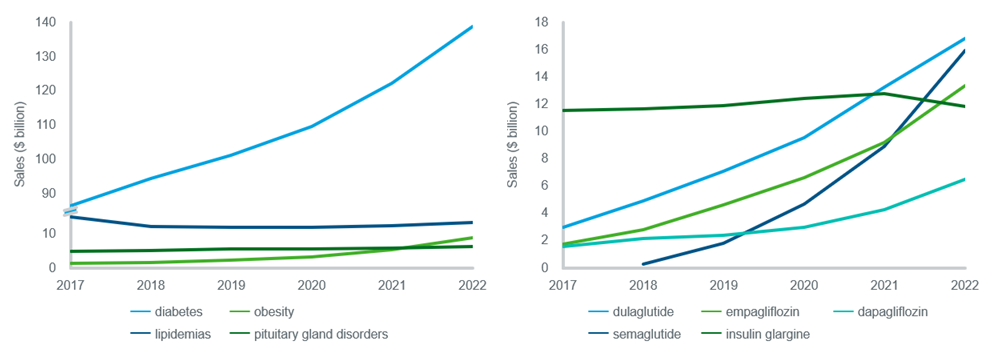
Source: IQVIA MIDAS Disease. Sales are global and ex-manufacturer, calculated using a constant exchange rate. In the first line chart, the value of each indication is the total value of all its respective products. In the second line chart, the value of each molecule is its value within the diabetes market only.
Of the well-established growth drivers of the diabetes market, Ozempic/Rybelsus (semaglutide) is the most significant, in terms of both absolute and YOY growth; this GLP-1 agonist had an impressive 2021-22 YOY growth rate of 79%. Ozempic received FDA approval at the end of 2017 (with Rybelsus being almost two years later), making it one of the most recently launched of these diabetes drivers. Trulicity (dulaglutide) – another GLP-1 agonist – is currently the market leader for diabetes. Its sales have grown consistently during the last five years, demonstrated by its 2017-22 CAGR of 42%, although its 2021-22 YOY growth rate of 27% reveals that growth is now decelerating.
Two of the main drivers within the diabetes market are SGLT2 inhibitors: Jardiance (empagliflozin) sales have increased consistently during the last five years, with a 2017-22 CAGR of 50%, while Forxiga (dapagliflozin) sales have picked up more recently, with a 2021-22 YOY growth rate of 52%.
The newest driver of the diabetes market is Mounjaro (tirzepatide), launched in the US in just June 2022. This drug – the only FDA-approved GIP and GLP-1 agonist – has had a stand-out launch. Its first few months of sales alone (over $2 billion at ex-manufacturer list price for the remainder of 2022) make it the fourth-largest driver of absolute growth in the diabetes market in 2022.
Obesity has also grown in value at a striking rate, with growth recently accelerating; its 2017-22 CAGR was 47% and its 2021-22 YOY growth rate was 69%. The obesity market is heavily dominated by semaglutide – branded as Wegovy for this indication. As in the diabetes market, its sales for obesity are increasing significantly YOY, at a rate of 92%. Saxenda (liraglutide) has the second-largest share of the obesity market; its 2021-22 YOY growth rate was 45%. Together, Wegovy and Saxenda constituted 92% of the obesity market in 2022. In August 2023, Wegovy was shown to lead not just to weight loss but also to improved cardiovascular outcomes; the significance of this is examined in the IQVIA blog Novo’s SELECT trial delivers, with far-reaching implications for obesity. The IQVIA white paper A renaissance for cardiometabolic innovation also dives into the obesity market, and explores the latest breakthroughs in cardiometabolic innovation.
DOACs are driving growth in some of the highest-value cardiovascular indications
Hypertensives dominate the cardiovascular disease area by value, but the hypertension market is mature and has changed little during the last five years. However, there has been much innovation in many other cardiovascular diseases, illustrated by the upward trends in value of four of the major cardiovascular indications.
Figure 2: total sales for 5 major cardiovascular indications; sales of the top 4 atrial fibrillation drugs
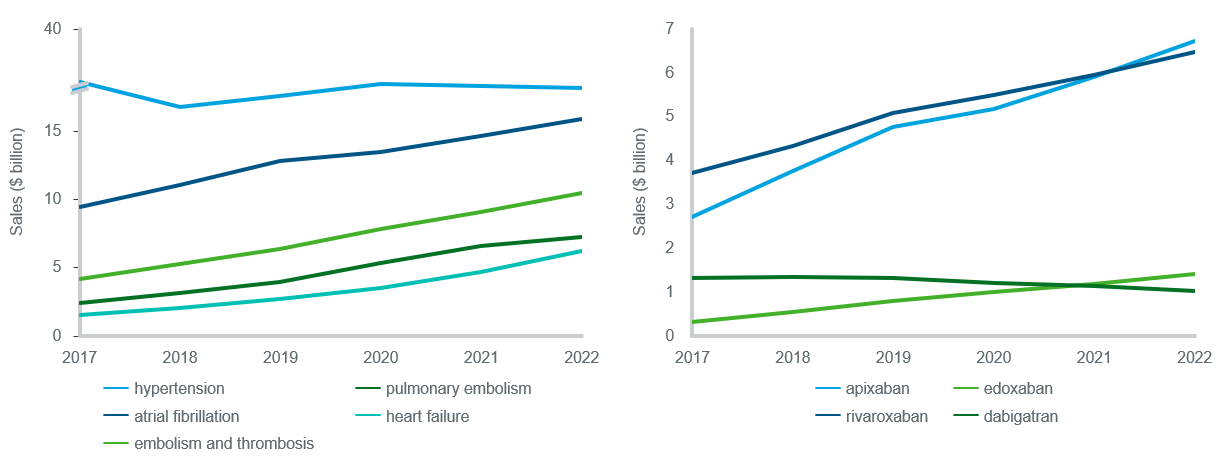
Source: IQVIA MIDAS Disease. Sales are global and ex-manufacturer, calculated using a constant exchange rate. In the first line chart, the value of each indication is the total value of all its respective products. In the second line chart, the value of each molecule is its value within the atrial fibrillation market only.
Two DOACs are well-established leaders within the atrial fibrillation market: Eliquis (apixaban) and Xarelto (rivaroxaban). Of these, Eliquis is growing faster, with a 2021-22 YOY growth rate of 14%, versus 9% for Xarelto, and became the market leader in 2022. Lixiana (edoxaban) – another DOAC – is the third-biggest product in this market by value, and also contributes to the absolute growth of atrial fibrillation.
DOACs are very dominant in other indications too, including the embolism & thrombosis market, and the pulmonary embolism market; in fact, the trends in these two markets are very similar. For both, Eliquis is the highest-value product, with roughly a 70% share of each market in 2022 and a double-digit growth rate. Eliquis is followed by Xarelto, which has around a 20% share of each market, and a single-digit YOY growth rate. Almost all other products in these markets are falling in value, with the exception of Lixiana, which is growing at a rate of almost 20% YOY, although its value share of each market remains below 1%.
The heart failure market has grown fast, with a 2017-22 CAGR of 32% and a 2021-22 YOY growth rate of 33%; these growth rates are greater than those of any other high-value (over $1 billion in 2022) cardiovascular indication. The heart failure market is dominated almost entirely by Entresto (sacubitril/valsartan), which was approved by the FDA in 2015 and is currently growing in value at 39% YOY. However, Forxiga and Jardiance – originally type 2 diabetes drugs – have also entered the heart failure market, and despite their 2022 sales for heart failure being less than 10% of those of Entresto, they are growing rapidly in value, at rates of 93% and 58% YOY respectively.
Migraine rises to the second-largest CNS indication by value, fuelled by recent innovation
In recent years, the global CNS market has grown more slowly than the overall pharmaceutical market, with a 2017-22 CAGR of 3%. However, as the IQVIA white paper Two Steps Forward, One Step Back: The Long Road to Success in CNS explores, growth is accelerating, reflected in its 2021-22 YOY growth rate of 6%.
Figure 3: total sales for the 5 highest-value CNS indications; sales of the top 5 migraine molecules
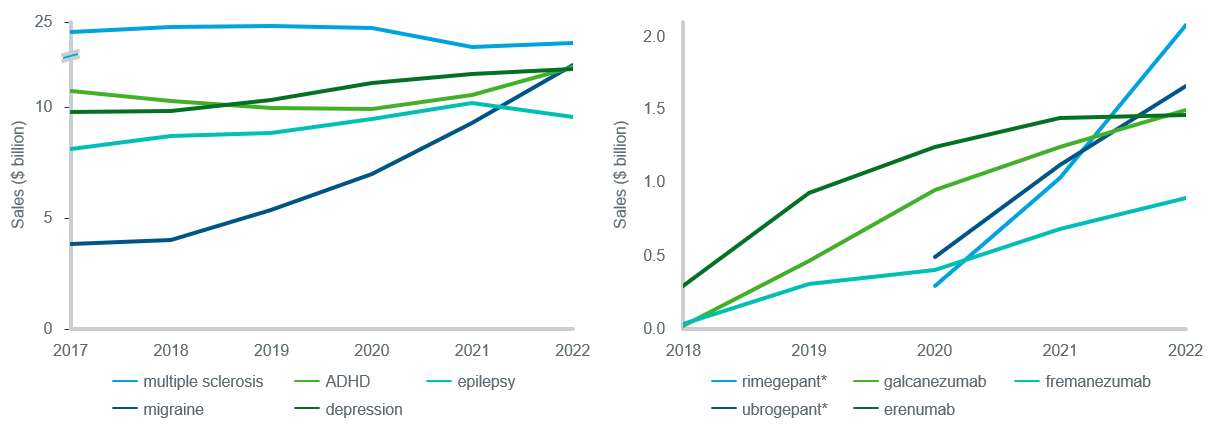
Source: IQVIA MIDAS Disease. Sales are global and ex-manufacturer, calculated using a constant exchange rate. In the first line chart, the value of each indication is the total value of all its respective products. In the second line chart, the value of each molecule is its value within the migraine market only. *Rimegepant and ubrogepant were launched in 2020.
Multiple sclerosis (MS), worth $24 billion in 2022, dominates the CNS market. Despite the MS market being weighed down by generics, two anti-CD20 monoclonal antibody therapies are growing rapidly here. One of these is Ocrevus (ocrelizumab) – MS market leader with a market share more than twice that of any other product – which is growing at 20% YOY. The second – Kesimpta (ofatumumab) – was approved by the FDA more recently, in mid-2020, and grew at 170% YOY from 2021-22.
Migraine therapies were worth $12 billion in 2022, making the migraine market the second largest within CNS by value, at half the size of MS. Migraine has been a consistent growth driver since 2018, due to many products entering the market; some of these are shown in Figure 3. Vydura/Nurtec (rimegepant) is a notable example; this oral CGRP antagonist received FDA approval in early 2020 and has already become the migraine market leader, with a YOY growth rate of over 100%. Ubrelvy (ubrogepant) – another oral CGRP antagonist – has also had a successful launch following FDA approval in December 2019.
The first three articles of this series have explored some of the key indications and products driving growth in value across six disease areas; these are naturally dominated by branded products. The final article will examine generics and biosimilars, with a focus on the key drivers of growth in volume across a number of therapy areas and indications.
To access additional resources about MIDAS Disease, such as fact sheets, on-demand webinar, blog articles and to inquire about a demo, please click here.