


Related Blog
Emerging and Established Biopharma Renegotiate the Value of Clinical Innovation


Developing IQVIA’s positions on key trends in the pharma and life sciences industries, with a focus on EMEA.
Learn more
Developing IQVIA’s positions on key trends in the pharma and life sciences industries, with a focus on EMEA.
Learn more

Developing IQVIA’s positions on key trends in the pharma and life sciences industries, with a focus on EMEA.
Learn more
Developing IQVIA’s positions on key trends in the pharma and life sciences industries, with a focus on EMEA.
Learn more
"We strive to help improve outcomes and create a healthier, more sustainable world for people everywhere.
LEARN MORE
Reimagine clinical development by intelligently connecting data, technology, and analytics to optimize your trials. The result? Faster decision making and reduced risk so you can deliver life-changing therapies faster.
Research & Development Overview
Generate and disseminate evidence that answers crucial clinical, regulatory and commercial questions, enabling you to drive smarter decisions and meet your stakeholder needs with confidence.
REAL WORLD EVIDENCE OVERVIEW
Elevate commercial models with precision and speed using AI-driven analytics and technology that illuminate hidden insights in data.
COMMERCIALIZATION OVERVIEW
Orchestrate your success across the complete compliance lifecycle with best-in-class services and solutions for safety, regulatory, quality and medical information.
COMPLIANCE OVERVIEW
When your destination is a healthier world, making intelligent connections between data, technology, and services is your roadmap.
TECHNOLOGIES OVERVIEWExplore our library of insights, thought leadership, and the latest topics & trends in healthcare.
DISCOVER INSIGHTSAn in-depth exploration of the global healthcare ecosystem with timely research, insightful analysis, and scientific expertise.
SEE LATEST REPORTS
By making intelligent connections between your needs, our capabilities, and the healthcare ecosystem, we can help you be more agile, accelerate results, and improve patient outcomes.
LEARN MORE
Building on a rich history of developing AI for healthcare, IQVIA AI connects the right data, technology, and expertise to address the unique needs of healthcare. It's what we call Healthcare-grade AI.
LEARN MORE
The IQVIA Human Data Science Cloud is our unique capability designed to enable healthcare-grade analytics, tools, and data management solutions to deliver fit-for-purpose global data at scale.
LEARN MORE
The IQVIA Innovation Hub connects start-ups with the extensive IQVIA network of assets, resources, clients, and partners. Together, we can help lead the future of healthcare with the extensive IQVIA network of assets, resources, clients, and partners.
LEARN MORE
IQVIA Decentralized Trials deliver purpose-built clinical services and technologies that engage the right patients wherever they are. Our hybrid and fully virtual solutions have been used more than any others.
LEARN MORE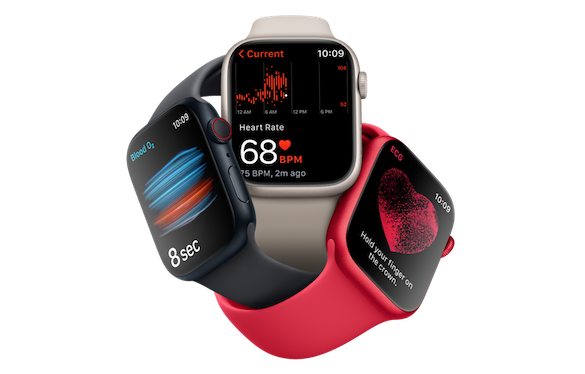
Empowering patients to personalize their healthcare and connecting them to caregivers has the potential to change the care delivery paradigm. IQVIA and Apple are collaborating to bring this exciting future of personalized care directly to devices patients already have and use.
LEARN MOREOur mission is to accelerate innovation for a healthier world. Together, we can solve customer challenges and improve patient lives.
LEARN MORECareers, culture and everything in between. Find out what’s going on right here, right now.
LEARN MORE
"Improving human health requires brave thinkers who are willing to explore new ideas and build on successes. Unleash your potential with us.
SEARCH JOBSEmerging biopharma (EBP) companies are at the root of early-stage drug development and their performance, the environment in which they operate, and their relationship to other stakeholders in the health system play a critical role in determining the future of many novel therapies and health technologies. The report provides clarity on the current landscape of EBP companies and their emerging product pipelines, clinical trial activity and levels of trial success. In addition, the report focuses on the financial deals, strategies, and organizational archetypes that lead to EBPs effectively developing and/or marketing novel products, as well as providing an assessment of the overall outlook for EBPs, with a focus on how key trends will shape future achievements.
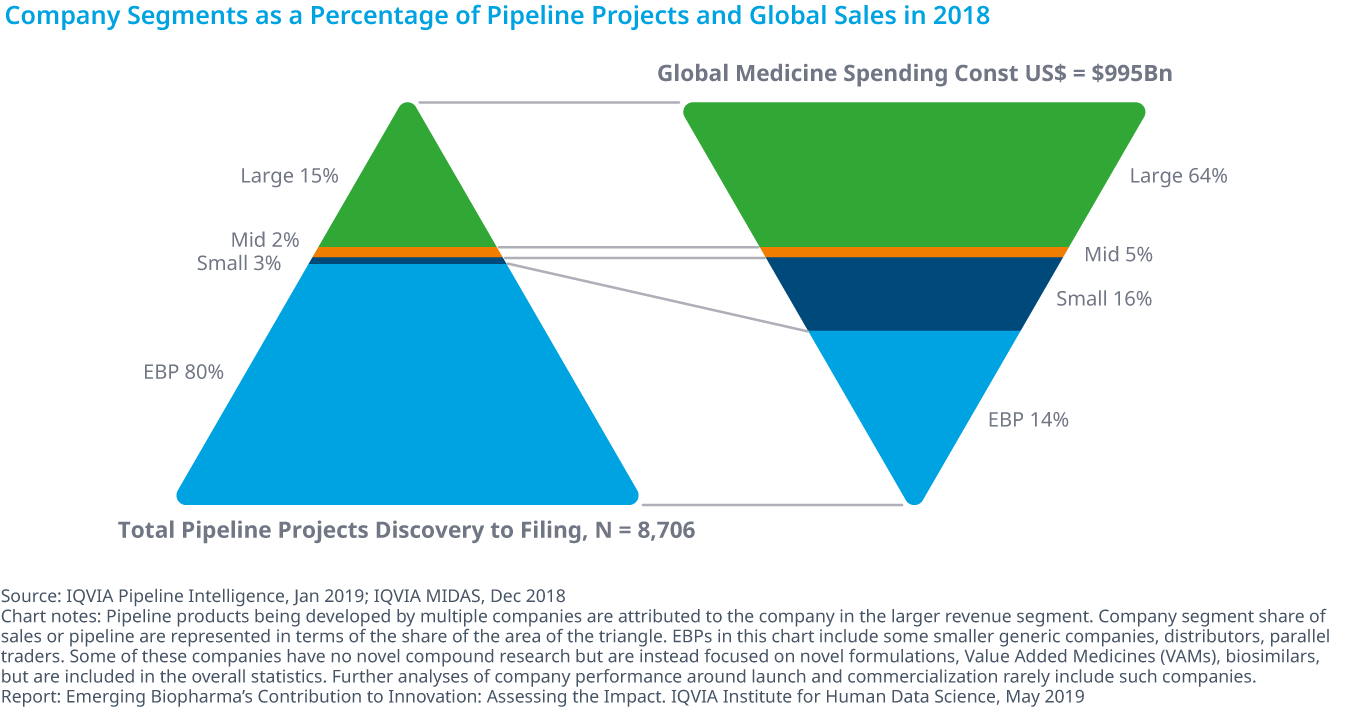
Emerging biopharma (EBP) is a segment of companies driving a large portion of innovation and development in the life sciences. EBP companies are defined as having less than $200 million in estimated annual spending on R&D, or under $500 million in global revenue. EBP’s encompass 3,212 companies in 2018 and account for 73% of late-stage research, up from 52% in 2003, and the number of molecules under development by EBPs grew by 15% in each of the past two years.
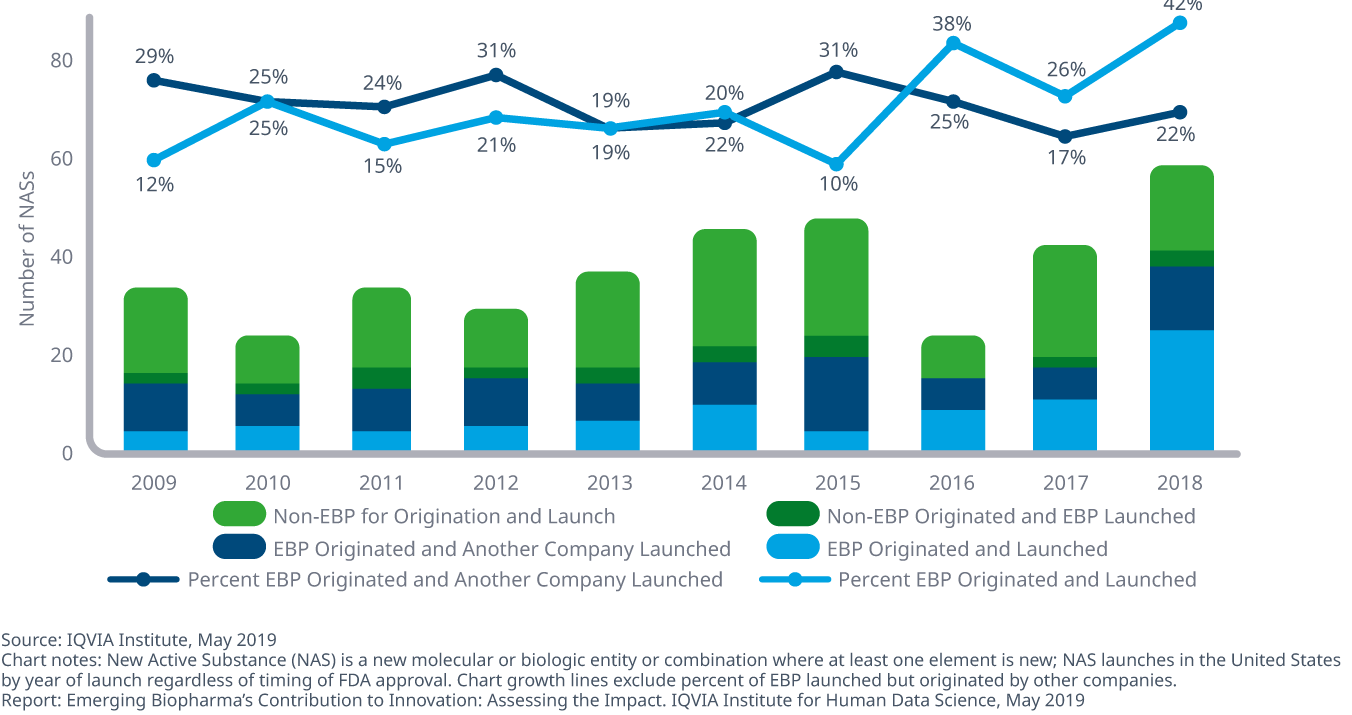
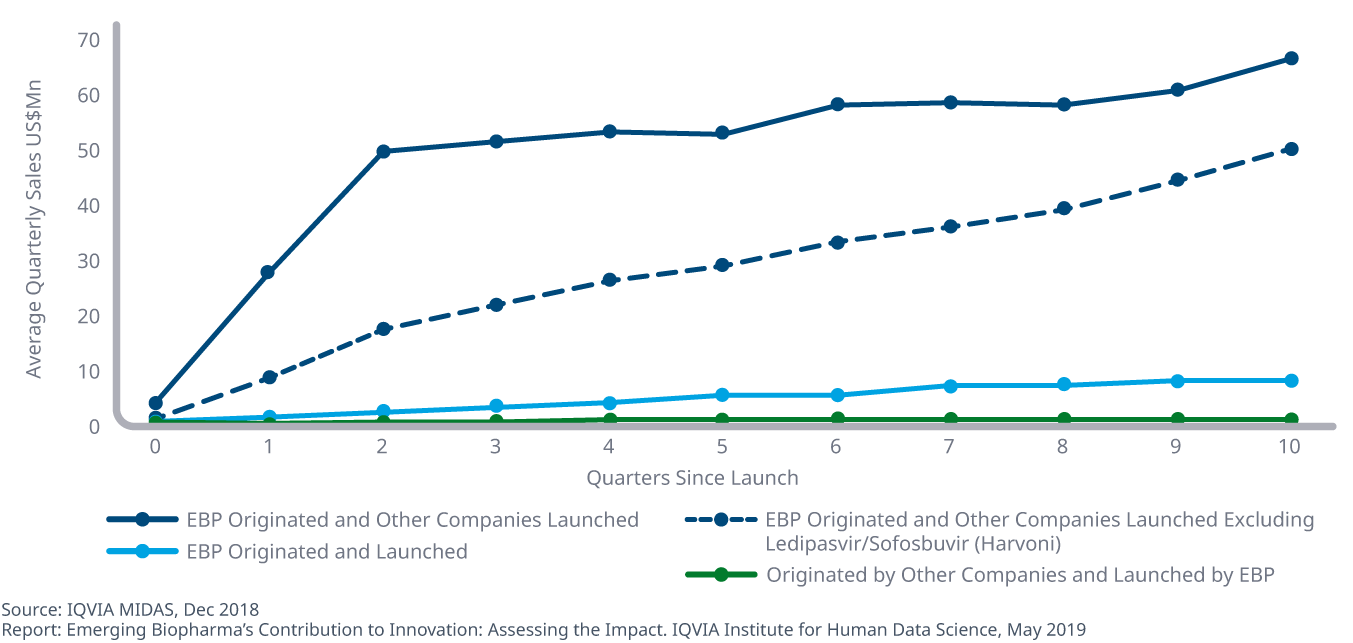
EBPs increasingly contribute to innovation, and these companies were the original patentees for 29 of the current top 100 drugs, which account for 40% of sales in the United States in 2018. For drugs launched in 2018, EBPs originated and launched 42% of the new drugs, up from 26% in 2017. EBP- originated products generally reach the market faster if they were acquired and launched by other company segments, and the median time for EBP companies to launch new drugs was 16.6 years in 2018, over 30% slower than other company segments.
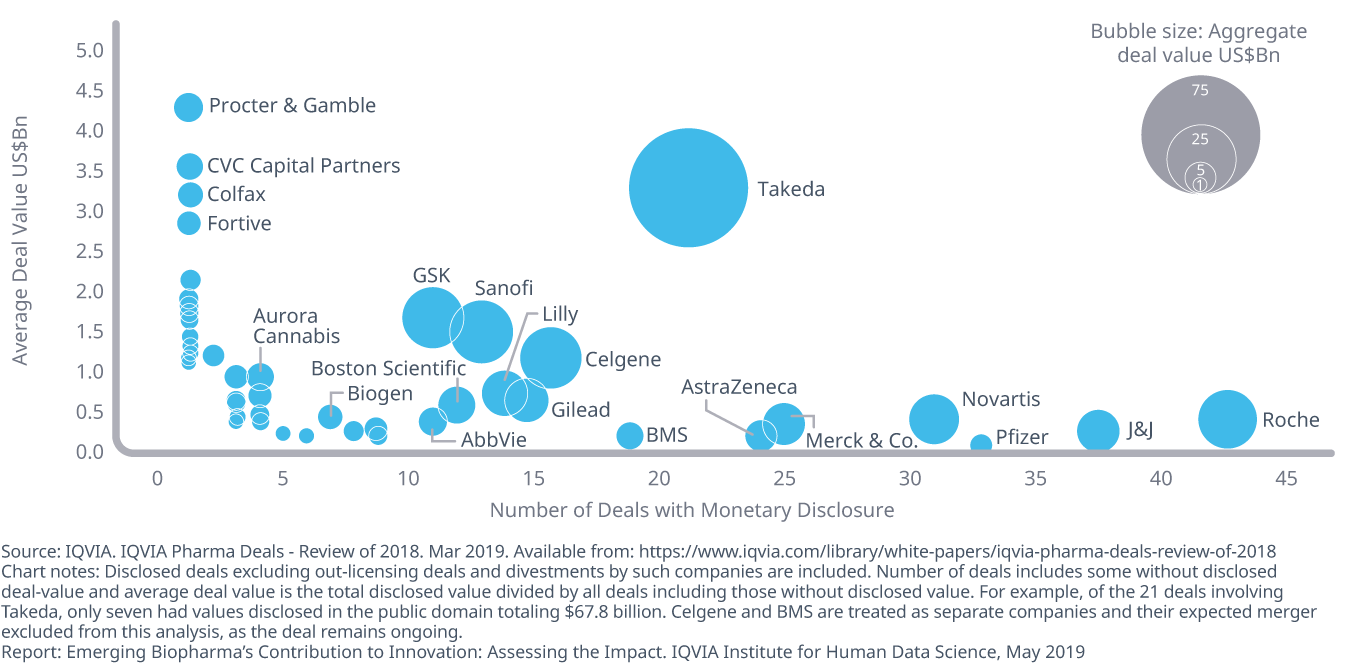
Partnering between EBPs and larger companies accounted for nine of the top ten partnering deals in 2018, and emerging biopharma companies were involved in seven of the top ten M&A deals in 2018. There was also a 78% increase in deals at pre-registration stage, or 62 deals compared with 36 in 2017. Large pharma continues to acquire or license assets between themselves and with EBPs, and in 2018, among 45 companies assessed, 415 deals were transacted for an aggregate disclosed value of $272 billion.
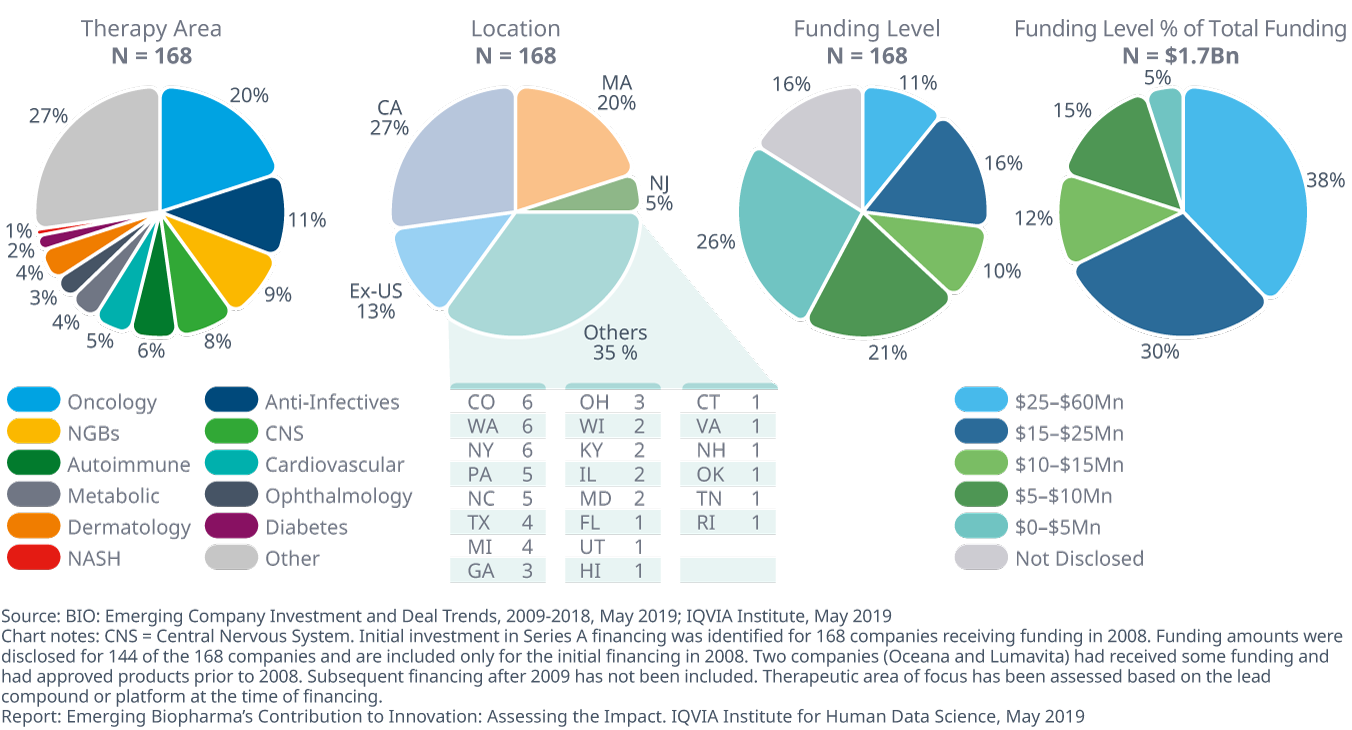
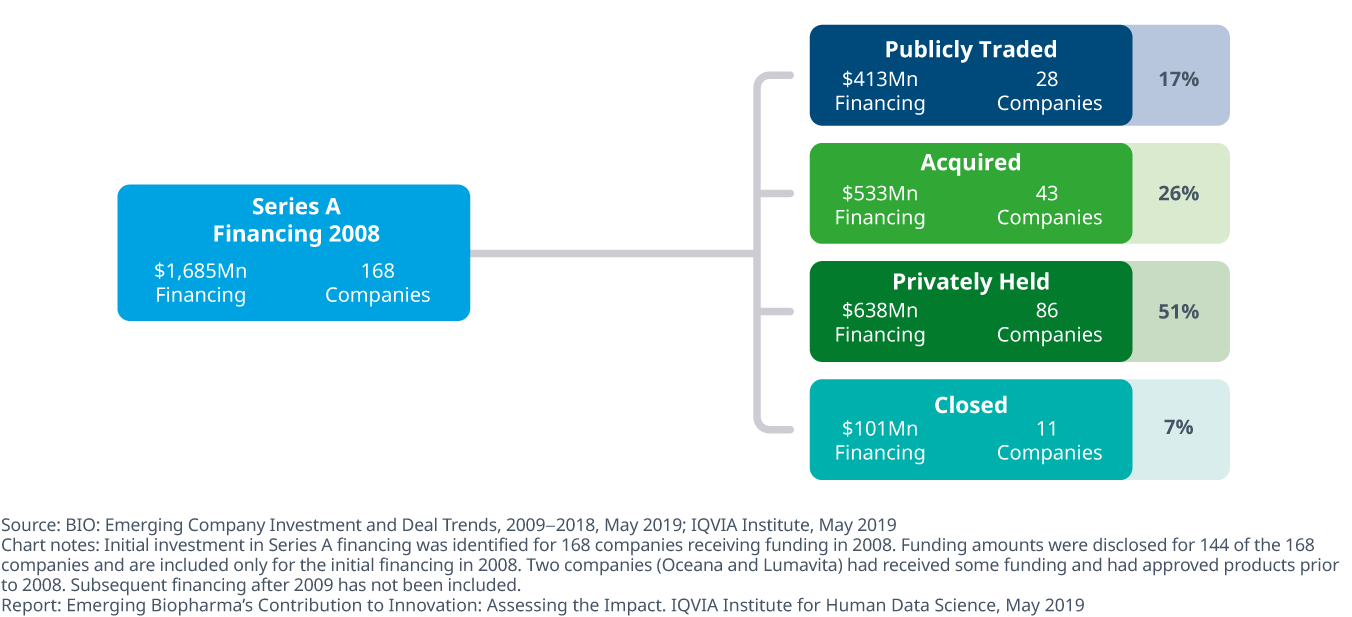
There were 168 startups which received series A funding in 2008, and ten years later these companies have achieved a variety of outcomes, providing a useful benchmark on performance for startups which have received funding more recently. Of these, 51% of companies were privately held and 17% had gone public. Of those 28 publicly-traded companies, five now have market capitalization of over $1 billion dollars.
Over the next five years, EBPs engaged in R&D and commercialization will face a changing environment and need to adapt accordingly. The use of biomarkers in clinical trials will have the greatest impact on EBP clinical development productivity, yielding a 34% increase on average, and pools of pre-screened, which aid in trial recruitment, will lead to an average increase in productivity of 29%. In the next five to ten years, three key attributes will be important for EBPs to embrace to assure their success: the use of data and analytics, the adoption of technology and a critical need to employ flexible business models.