


SUBSCRIBE
IQVIA Blog Digest
For all the latest industry insights, please subscribe to the IQVIA U.S. blog digest.
The 340B Drug Discount Program (“340B Program”) has grown into a considerable market force, exacerbating the margin pressures that manufacturers already face in the United States. By the end of 2020, 340B Program sales made up 13% ($80B) of total U.S. pharmaceutical sales and grew four times faster than the overall pharmaceutical market (Growth of the 340B Program Accelerates in 2020). Understanding the drivers behind this growth is critical for stakeholders that must plan for and strategize around the program’s trajectory.
IQVIA’s Market Access Center of Excellence continues to track 340B prevalence and impact across the industry. Through data and advanced analytics, the insights derived play a key role informing policymakers, providers, and payers alike as they make changes to the policies and implementation of this important program.
Beneath the growth of 340B sales volume is an increase in the number of participating 340B entities, which are reported by the 340B Program administrator, Health Resources & Services Administration (HRSA). Between 2010 and 2020, the number of participating covered entities grew by 50%, from 3,600 unique covered entities to more than 5,000. However, the number of sites – provider locations affiliated with these entities – grew seven times over within the same period. This pattern of growth among individual sites from a comparatively steady number of unique entities reflects the increasing eligibility and interest of participation, rather than the expansion of covered entities themselves.
Even more, contract pharmacies outpaced entity and site growth, becoming the largest driver of 340B Program expansion. In 2010, there were fewer unique contract pharmacy locations than there were unique entities. By 2020, the number of contract pharmacies increased nearly fifteen times, and today there are more than 28,000 contract pharmacies participating in the 340B Program.
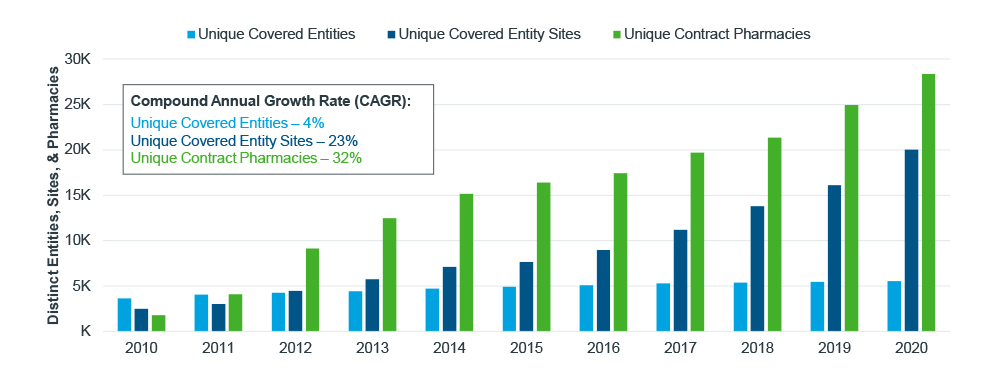
Figure 1: Number of distinct entities, sites, and pharmacies in 340B
Source: HRSA Office of Pharmacy Affairs (OPAIS) 340B
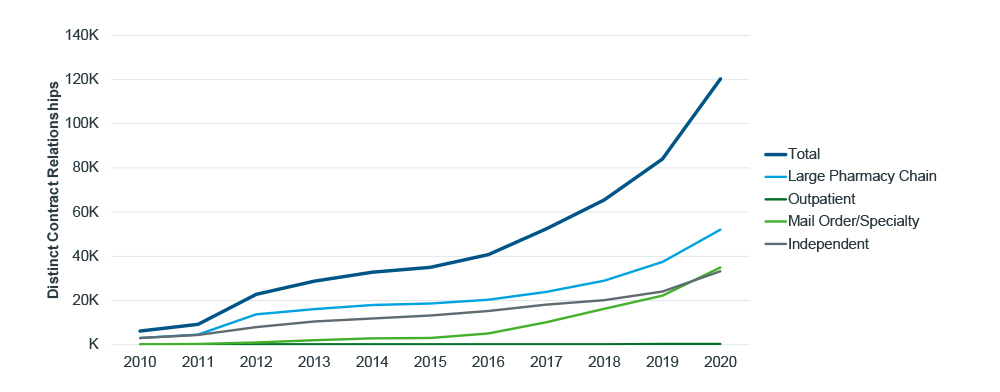
Contracts between participating pharmacies and covered entities, referred to as “relationships” by HRSA, grew faster still than the number of unique entities, sites, and pharmacies. Not only are more pharmacies participating in 340B, but they are affiliating with an increasing number of contracted sites, further saturating their footprints with 340B eligibility. Large pharmacy chains have been driving a bulk of the growth in entity-pharmacy relationships since 2010, increasing more than 16 times over and facilitating the rapid expansion of 340B. Entire networks of pharmacies - with broad geographic reach - are able to come online through the use of a single contract negotiation. This is unique to the nature of these large chains.
Specialty and mail order pharmacies, another rapidly growing segment, were not a growth driver for 340B until 2016, when the number of covered entity relationships began to increase, growing more than 60% on average every year - twice the rate of large chain contracts (20%). As part of their business model, mail order and specialty pharmacies can be located hundreds and thousands of miles away from their contracted covered entity and the patients filling prescriptions, thus removing geographic barriers as a factor preventing 340B program participation. Furthermore, the narrowing of pharmacy distribution for specialty products by the large pharmacy benefits managers (PBMs) have also served to push more volume through vertically integrated models.
As 340B participation and networks expand, so too has the program’s geographic reach. In the last five years, the proportion of U.S. zip codes with a contract pharmacy grew from 39% to 68%, expanding beyond the coasts and into rural and middle America over this period.
Mail order and specialty pharmacies decouple distance and 340B accessibility, enabling any patients of a covered entity to potentially fill 340B prescriptions remotely. These pharmacies, by nature, are not always proximal to their contracted entities. As the number of specialty/mail relationships increase and more of these pharmacies participate in 340B, the average distance between pharmacies and entities also has increased. This, in turn, has enabled out-of-state distances between entity sites and chain/mail pharmacies to exceed 1,000 miles in 2020. In-state chain and independent pharmacies have also formed relationships with covered entities at greater distances since 2015 when, on average, they were 15 miles from their entity sites. In 2020, this increased to an average of 23 miles. As more contract pharmacies begin participating in a wider radius around a covered entity, a broader portion of the patient population will be able to fill 340B prescriptions at the pharmacy.
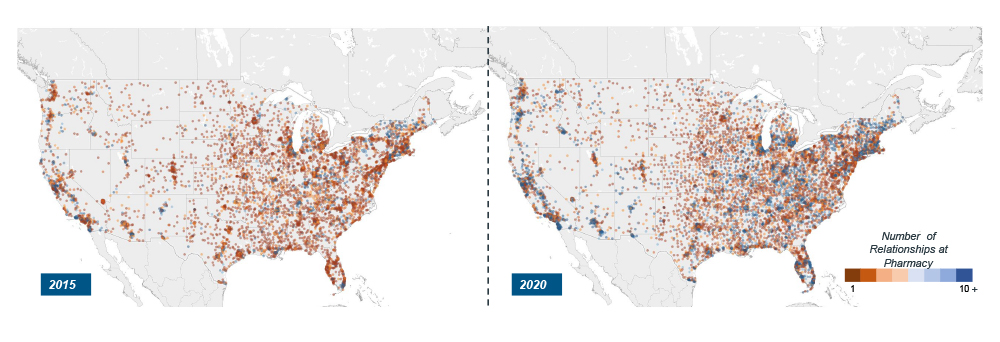
Figure 3: Map of contract pharmacies and number of relationships
Note: Each dot on the map represents a single contract pharmacy; the dot color reflects the number of relationships at a given pharmacy
Source: HRSA Office of Pharmacy Affairs (OPAIS) 340B
As 340B expansion continues, more providers and patients will have access to the program. Yet, in addition to better reaching underserved communities, this expansion raises the stakes for those who must ensure 340B discounts reach the intended population. The breadth and depth of the 340B Program presents unseen challenges – in the form of duplicate discounts, diversion, etc. - for manufacturers, many of whom are investing in capabilities to address them. These tactics include operational processes such as identifying duplicate discounts, distribution concentration, and legal petitions.
Mitigation tactics aside, brands with high rebates and 340B exposure must account for this rapidly increasing gross-to-net line item in their forecasting and planning. However, 340B does not exist in a vacuum. It is, rather, one element of the larger market access ecosystem that should be considered alongside rebates, discount cards, etc. Recent policy examples highlight the web of discounts and interdependencies affecting 340B and margin. The Centers for Medicare & Medicaid Services’ (CMS) recent change to best price calculations will include accumulator buy-downs, and thus, could increase the top-line discounts as well as the hidden costs of 340B participation for manufacturers. President Biden’s American Rescue Plan Act (ARPA) removes the cap on Medicaid rebates so that manufacturer discounts could exceed 100% in Medicaid. Though “penny pricing” would still apply in 340B, that is a rule that could change to mirror Medicaid’s standard.
Neither policy would take effect until 2023 and 2024, respectively, but they demonstrate the program’s susceptibility to policy changes. One way to prepare for these new margin pressures is to understand the demand-side drivers of the 340B volume and incorporate these insights into forecasting and strategic planning decision making processes. When companies account for the individual growth drivers such as entity and pharmacy expansion, manufacturers will be better positioned for the uncertainty ahead.
Acknowledgements
The authors of this blog would like to thank Diane Weisbrod, Rory Martin, Steve Krikorian, and IQVIA’s Contract Performance Solutions team for their support.
