Every year, U.S. Centers for Medicare & Medicaid Services (CMS) publishes new data from its Open Payments program, “a statutorily required, national disclosure program that promotes transparency and accountability.” Open Payments collects and publishes information about financial relationships between drug and medical device companies (a.k.a. “reporting entities”) and certain health care providers (“covered recipients”). These relationships may involve payments to providers for things such as research, meals, travel, gifts or speaking fees (among others).
Since the inception of the Open Payments program in FY 2014, CMS has published more than 78 million records totaling over $59 billion. In 2021, the program published 12.1 million records reflecting a value of $10.9 billion.
CMS Open Payments was developed to “provide the public with a more transparent health care system,” but it is also a unique and powerful tool for life sciences companies to analyze how their spending compares to peers in certain categories. As you might imagine, however, there is a big difference between having access to 78 million records and making sense of those records. For compliance stakeholders that struggle to obtain a structured analysis that makes the data accessible and usable, IQVIA offers brand- and channel-specific analyses about commercial engagements that deliver a comprehensive view of the competitive landscape.

PUTTING TRANSPARENCY DATA TO WORK FOR YOU
Transparency data from CMS can provide a variety of useful benchmark information that can drive greater insights around spend and utilization. For example, you can drill down on spend related to specific HCPs, brands, specialties, geographies, and more, across a number of payment categories. Careful analysis of this data can help identify a range of trends, such as how key opinion leaders (KOLs) and other experts are used in comparison with competitors.
There are two ways that one can access the Open Payments data: 1) through a web-based search of entity and covered recipient-level data, and 2) by downloading and analyzing the entire dataset for each year. The first option is a great way to quickly explore specific companies or recipients, but the second option is the more comprehensive approach that enables us to see the bigger picture and create more robust analyses.
For individual compliance stakeholders, the downside to this second, more robust approach is that it requires a lot of time and effort in order to create a structured, comprehensive dataset that is suitable for a deeper range of analyses. This is where IQVIA comes in.
After acquiring each year’s complete dataset, IQVIA is able to develop aggregated insights across this competitive landscape in order to answer questions such as “What are my competitors spending in aggregate in terms of a particular reporting entity? At a specific product level? On a particular type of engagement?” Along with additional data that IQVIA can provide around KOL mapping and influence mapping and other promotional or program benchmarking services, this data can be used to enable better decision-making and a clearer understanding of basic questions like “How does my company (or my product, or my commercial strategy) compare to the rest of the industry?”
EXAMPLE: OVERALL SPEAKER PAYMENTS
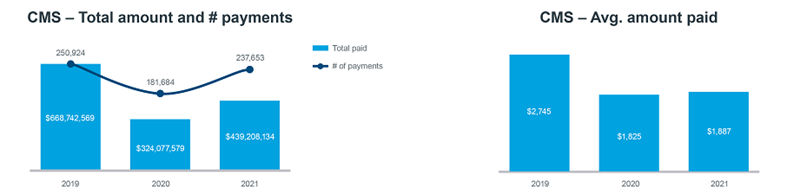
At IQVIA, we’re continually digging into the CMS data and eager to share the many ways it can provide useful, directional guidance around what’s happening in the industry and what that might mean for your operations. For example, let’s say you wanted to explore general trends related to spending on speaker fees (specifically, in terms only a bureaucrat could appreciate, “speaker payments using the compensation for services other than consulting, including serving as faculty or as a speaker at a venue other than continuing education programs”). Open Payments includes spending data according to categories such as meals (“food & beverage”), speaker payments, and consulting fees; and this data shows how much was paid, on what date, and the form of payment (in-kind or direct). The data identifies the speaker, the type of HCP (credentials or specialties), and their location, among other attributes.
With all this data at hand, we can quickly capture (among many other things) recent trends in overall speaker payments and make some year-to-year comparisons. Most of us would probably expect that 2021 volume and spend would differ from 2020, given where we are in terms of the pandemic. As the charts below suggest, that certainly looks to be the case. Even more interestingly, while the overall number of payments made in 2021 are very close to (largely pre-pandemic) 2019, the average payment looks much closer to 2020 than it does to 2019.