-
Americas

-
Asia & Oceania

-
A-I
J-Z

EMEA Thought Leadership
Developing IQVIA’s positions on key trends in the pharma and life sciences industries, with a focus on EMEA.
Learn more -
Middle East & Africa

EMEA Thought Leadership
Developing IQVIA’s positions on key trends in the pharma and life sciences industries, with a focus on EMEA.
Learn more
Regions
-
Americas
-
Asia & Oceania
-
Europe
-
Middle East & Africa
-
Americas
-
Asia & Oceania
-

Europe
Europe
- Adriatic
- Belgium
- Bulgaria
- Czech Republic
- Deutschland
- España
- France
- Greece
- Hungary
- Ireland
- Israel
- Italia
EMEA Thought Leadership
Developing IQVIA’s positions on key trends in the pharma and life sciences industries, with a focus on EMEA.
Learn more -
Middle East & Africa
EMEA Thought Leadership
Developing IQVIA’s positions on key trends in the pharma and life sciences industries, with a focus on EMEA.
Learn more
SOLUTIONS
-
Research & Development
-
Real World Evidence
-
Commercialization
-
Safety & Regulatory Compliance
-
Technologies
LIFE SCIENCE SEGMENTS
HEALTHCARE SEGMENTS
- Information Partner Services
- Financial Institutions
- Public Health and Government
- Patient Associations
- Payers
- Providers
THERAPEUTIC AREAS
- Cardiovascular
- Cell and Gene Therapy
- Central Nervous System
- GI & Hepatology
- Infectious Diseases and Vaccines
- Oncology
- Pediatrics
- Rare Diseases
- View All

Impacting People's Lives
"We strive to help improve outcomes and create a healthier, more sustainable world for people everywhere.
LEARN MORE
Harness the power to transform clinical development
Reimagine clinical development by intelligently connecting data, technology, and analytics to optimize your trials. The result? Faster decision making and reduced risk so you can deliver life-changing therapies faster.
Research & Development OverviewResearch & Development Quick Links

Real World Evidence. Real Confidence. Real Results.
Generate and disseminate evidence that answers crucial clinical, regulatory and commercial questions, enabling you to drive smarter decisions and meet your stakeholder needs with confidence.
REAL WORLD EVIDENCE OVERVIEWReal World Evidence Quick Links

See markets more clearly. Opportunities more often.
Elevate commercial models with precision and speed using AI-driven analytics and technology that illuminate hidden insights in data.
COMMERCIALIZATION OVERVIEWCommercialization Quick Links

Service driven. Tech-enabled. Integrated compliance.
Orchestrate your success across the complete compliance lifecycle with best-in-class services and solutions for safety, regulatory, quality and medical information.
COMPLIANCE OVERVIEWSafety & Regulatory Compliance Quick Links

Intelligence that transforms life sciences end-to-end.
When your destination is a healthier world, making intelligent connections between data, technology, and services is your roadmap.
TECHNOLOGIES OVERVIEWTechnology Quick Links
CLINICAL PRODUCTS
COMMERCIAL PRODUCTS
COMPLIANCE, SAFETY, REG PRODUCTS

BLOGS, WHITE PAPERS & CASE STUDIES
Explore our library of insights, thought leadership, and the latest topics & trends in healthcare.
DISCOVER INSIGHTSTHE IQVIA INSTITUTE
An in-depth exploration of the global healthcare ecosystem with timely research, insightful analysis, and scientific expertise.
SEE LATEST REPORTS


FEATURED INNOVATIONS
-
IQVIA Connected Intelligence™
-
IQVIA Healthcare-grade AI™
-
Human Data Science Cloud
-
IQVIA Innovation Hub
-
Decentralized Trials
-
Patient Experience powered by Apple
WHO WE ARE
- Our Story
- Our Impact
- Commitment to Public Health
- Code of Conduct
- Environmental Social Governance
- Privacy
- Executive Team
NEWS & RESOURCES


Unlock your potential to drive healthcare forward
By making intelligent connections between your needs, our capabilities, and the healthcare ecosystem, we can help you be more agile, accelerate results, and improve patient outcomes.
LEARN MORE
IQVIA AI is Healthcare-grade AI
Building on a rich history of developing AI for healthcare, IQVIA AI connects the right data, technology, and expertise to address the unique needs of healthcare. It's what we call Healthcare-grade AI.
LEARN MORE
Your healthcare data deserves more than just a cloud.
The IQVIA Human Data Science Cloud is our unique capability designed to enable healthcare-grade analytics, tools, and data management solutions to deliver fit-for-purpose global data at scale.
LEARN MORE
Innovations make an impact when bold ideas meet powerful partnerships
The IQVIA Innovation Hub connects start-ups with the extensive IQVIA network of assets, resources, clients, and partners. Together, we can help lead the future of healthcare with the extensive IQVIA network of assets, resources, clients, and partners.
LEARN MORE
Proven, faster DCT solutions
IQVIA Decentralized Trials deliver purpose-built clinical services and technologies that engage the right patients wherever they are. Our hybrid and fully virtual solutions have been used more than any others.
LEARN MORE
IQVIA Patient Experience Solutions powered by Apple
Empowering patients to personalize their healthcare and connecting them to caregivers has the potential to change the care delivery paradigm. IQVIA and Apple are collaborating to bring this exciting future of personalized care directly to devices patients already have and use.
LEARN MOREWORKING AT IQVIA
Our mission is to accelerate innovation for a healthier world. Together, we can solve customer challenges and improve patient lives.
LEARN MORELIFE AT IQVIA
Careers, culture and everything in between. Find out what’s going on right here, right now.
LEARN MORE
WE’RE HIRING
"Improving human health requires brave thinkers who are willing to explore new ideas and build on successes. Unleash your potential with us.
SEARCH JOBSInstitute Report
Medicine Use and Spending in the U.S.
May 09, 2019
About the Report
The use of medicines in the United States is a critical factor influencing the health outcomes of millions of Americans. This report provides objective measures of medicine use and its costs to the U.S. healthcare system and patients, employers, health plans, intermediaries and state and federal government agencies.
The report specifically focuses on the volume of medicine use – with a special attention on opioids – drivers of change in the use of medicines, overall “net spending,” out-of-pocket costs to patients, and an outlook through 2023 for the pharmaceuticals market. It additionally examines the key dynamics around new product launches, patent expiries and the introduction of generics and biosimilars.
Report Summary
Medicine use has continued to rise, with Americans filling 5.8 billion prescriptions in 2018, a gain of 2.7% over the prior year. At the same time, prescription opioid volumes have declined by 43% since their peak in 2011, with the most potent and dangerous high-dose prescriptions declining by 61% over the same period. The use of specialty medicines grew by 5%, more than twice the rate of other drugs, and now represents 2.2% of volume.
In 2018, medicines spending growth in the United States rebounded to 4.5% on a net basis, while growth at the invoice-level was 5.7%. Net medicine spending was $1,044 per person, up 0.9% or $10 from 2017. Total net spending growth in 2018 was largely driven by more patients receiving existing branded drugs and using newly launched drugs.
In aggregate, patient out-of-pocket costs climbed in 2018 to an estimated $61 billion. Across all pay types, 8.8% of patients pay more than $500 for prescriptions. Commercially insured patients increasingly use manufacturer coupons to offset their initial cost exposure, and average final out-of-pocket costs remained at $42 per brand prescription.
The base case outlook in the next five years forecasts that net medicine spending in the United States will increase from $344 billion in 2018 to $420 billion in 2023, an aggregate growth of $76 billion and lower than the $84 billion growth seen over the past five years. The largest driver of this growth will be the launch of new branded drugs.
A number of policy changes are currently under consideration, and this report examines alternative forecast scenarios based on their impact on various attributes and stakeholders. In a scenario where reforms are limited to Medicare programs, out-of-pocket costs decline $14 billion and net spending decreases by as much as 6%. In another scenario, if reforms proposed for Medicare are extended to the commercial market, out-of-pocket costs would decline by 30% and drive net spending 9% lower than base case projections.
Key Findings
Americans are taking more prescription medicines: there were 5.8 billion prescriptions dispensed in the United States in 2018, up 2.7% from 2017
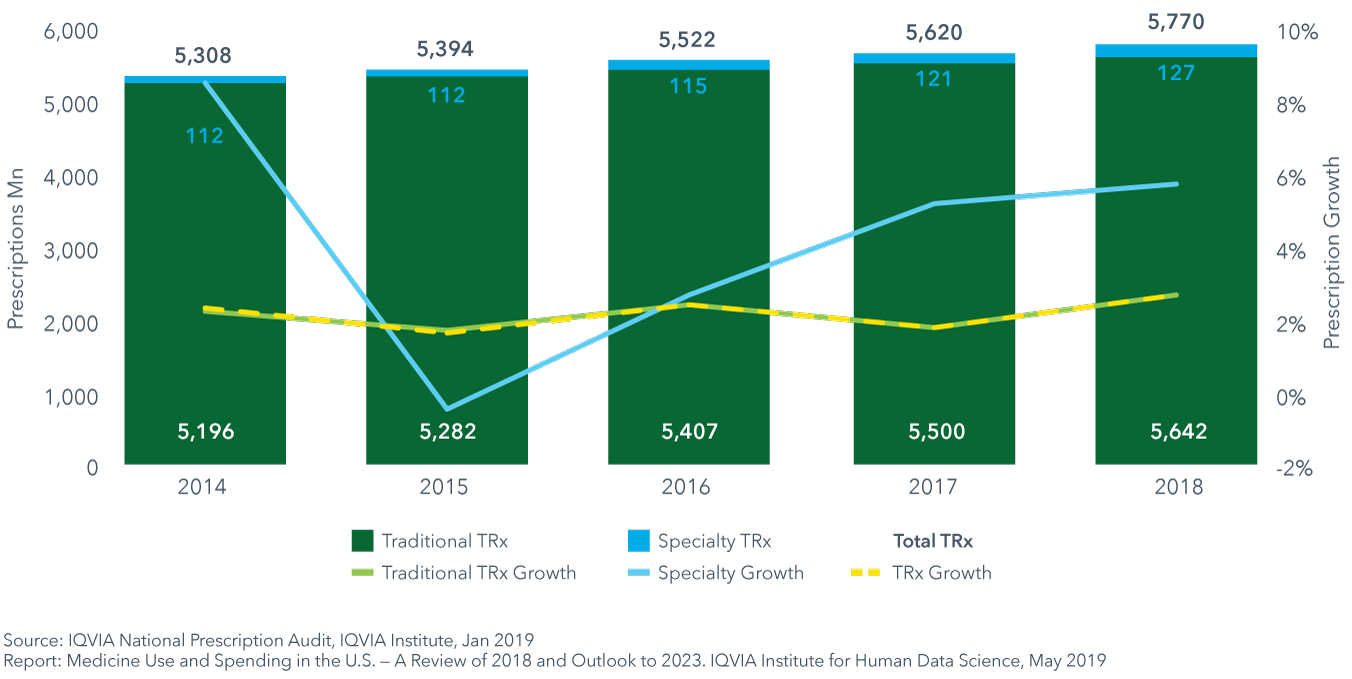
- In total, 127 million specialty prescriptions were dispensed in retail and mail pharmacies in 2018, up by 15 million since 2014.
- Specialty medicine prescriptions grew by over 5% even as those medicines account for only 2.2% of prescriptions and have little impact on the overall growth of dispensed prescriptions.
- Chronic prescriptions account for more than two-thirds of prescriptions, and the increasing use of 90-day prescriptions means patients have significantly more medicine on hand.
2018 saw the steepest drop in opioid prescription use – down 17.1% from 2017 levels
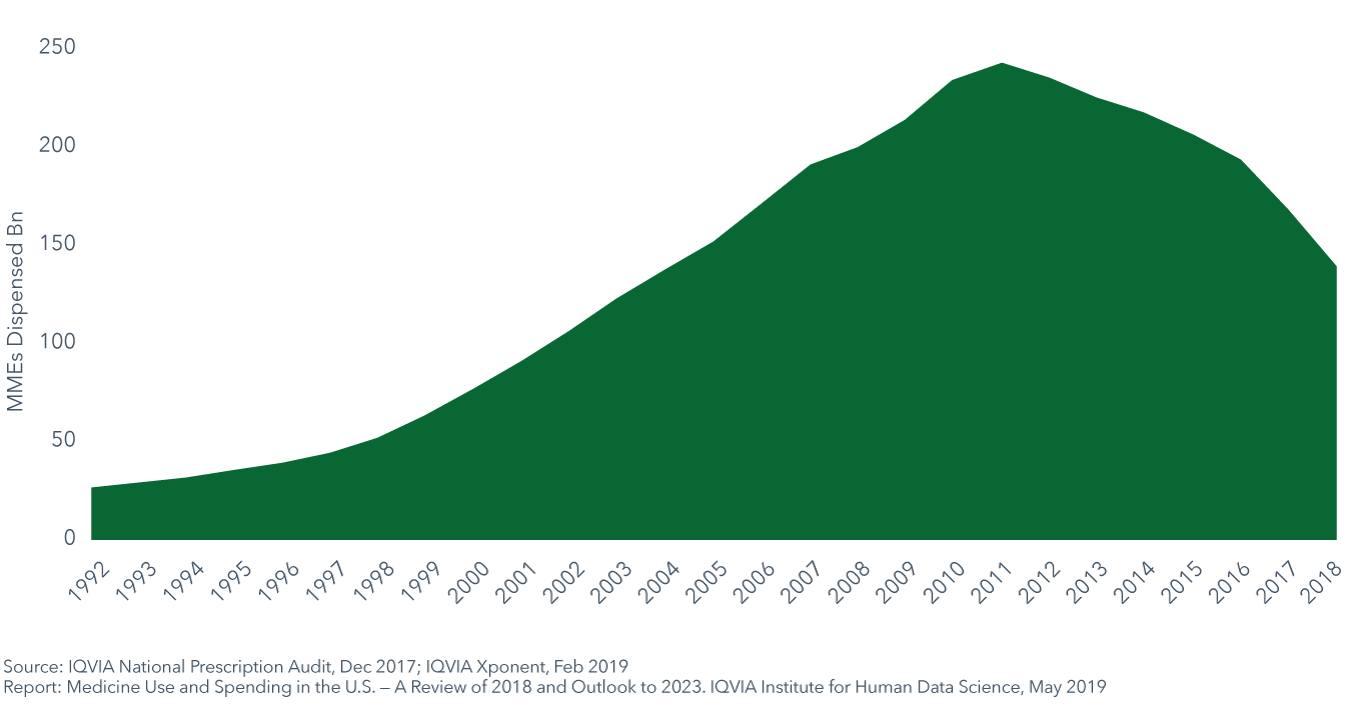
- 2018 saw the largest single-year decline in prescription opioid volume, dropping by 29.2 billion morphine milligram equivalents (MME).
- Overall opioid volumes in MME have declined by 43% since the peak in 2011, while prescriptions for 90 MMEs per day or greater declined by 61%.
- Decreases in prescription opioid volume have been driven by changes in clinical use, regulatory and reimbursement policies and legislation that has been increasingly restricting prescription opioid use since 2012.
Real net per capita spending grew by only $44 per person per year since 2009, as specialty drug spending nearly doubled and traditional spending declined
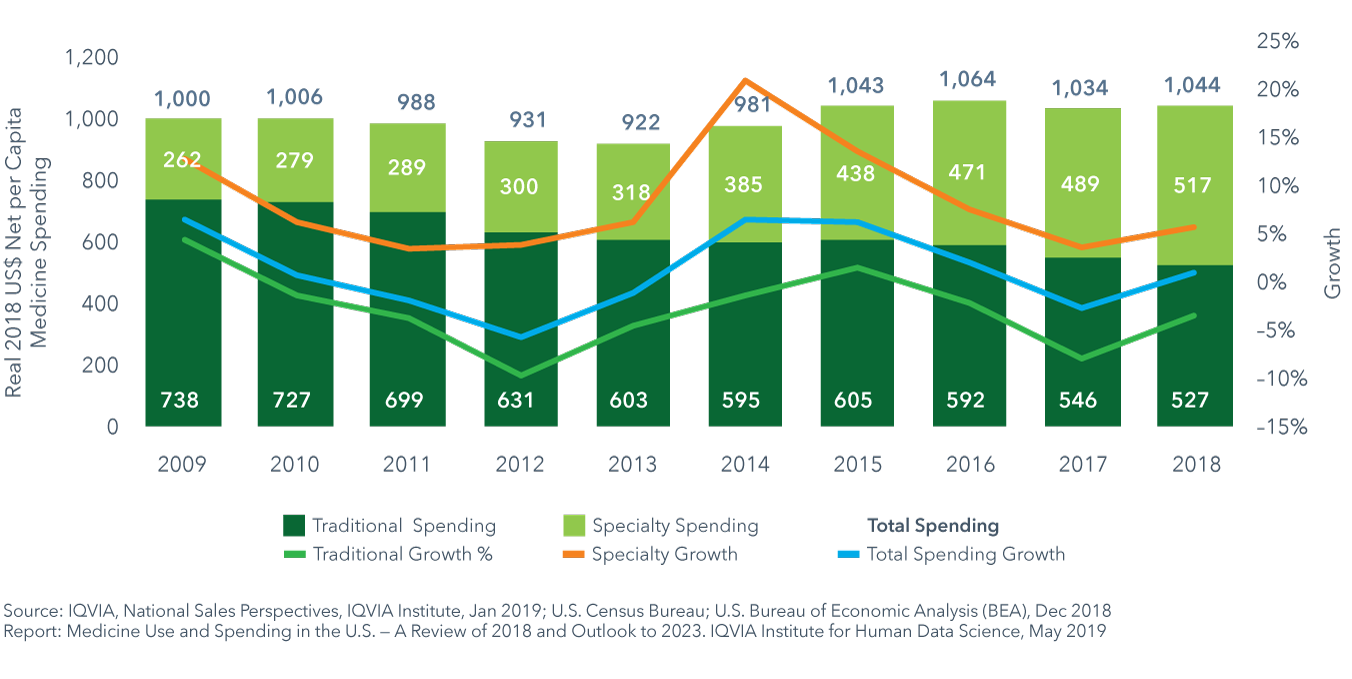
- Net price increases on branded drugs averaged only 0.3% in 2018.
- Real net per capita spending grew by 0.9% from $1,034 per person in 2017 to $1,044 in 2018, and by a 1.1% 10-year CAGR to 2018.
- Net spending on specialty medicines increased 5.8% on a per capita basis, while traditional medicine costs fell 3.4%.
Patient out-of-pocket costs are estimated at $61 billion in aggregate in 2018 – up $2 billion over 2017
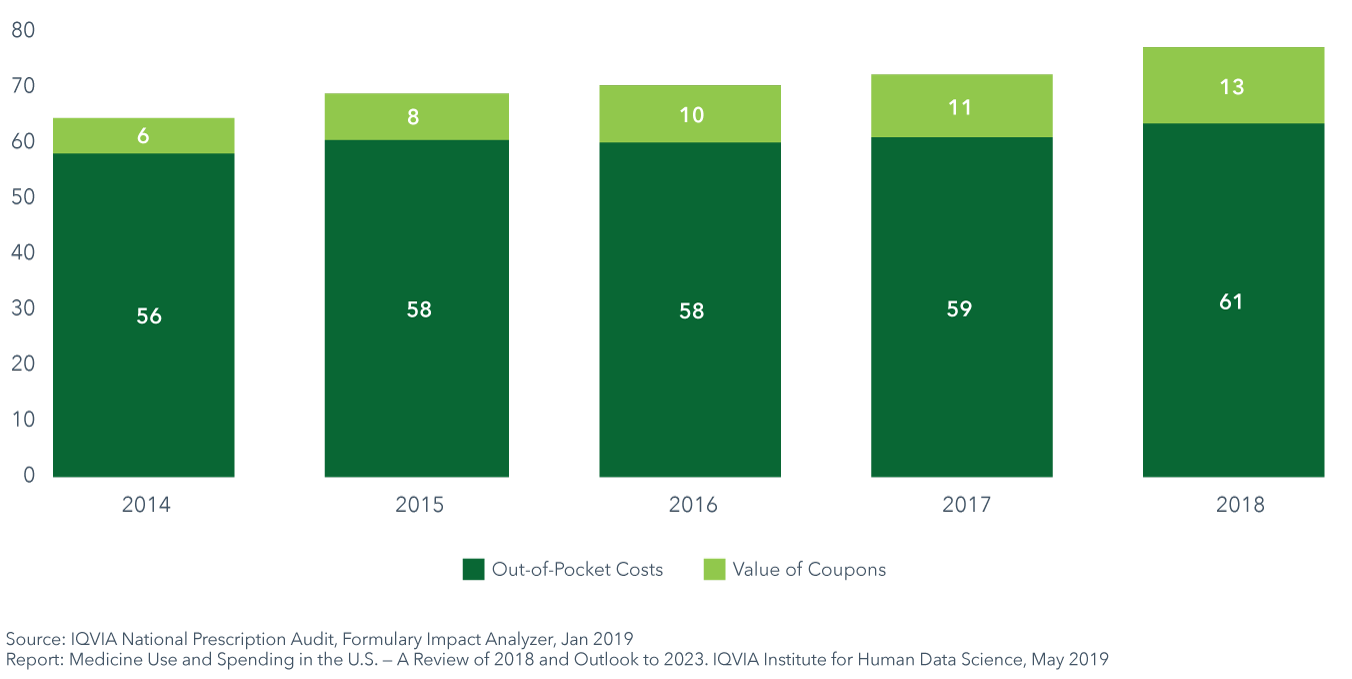
- Overall out-of-pocket costs have risen from $56 billion in 2014 to $61 billion in 2018 although some patients have seen their costs decline as generic prescription costs decline.
- As out-of-pocket costs have risen, $13 billion of costs have been offset by coupons for commercially insured patients.
- Of commercially insured patients on branded medications, 19% of them used coupons to reduce their out-of-pocket costs in 2018.
The potential impact in 2023 of pricing reform scenarios on key metrics relative to the 2018 baseline are substantial
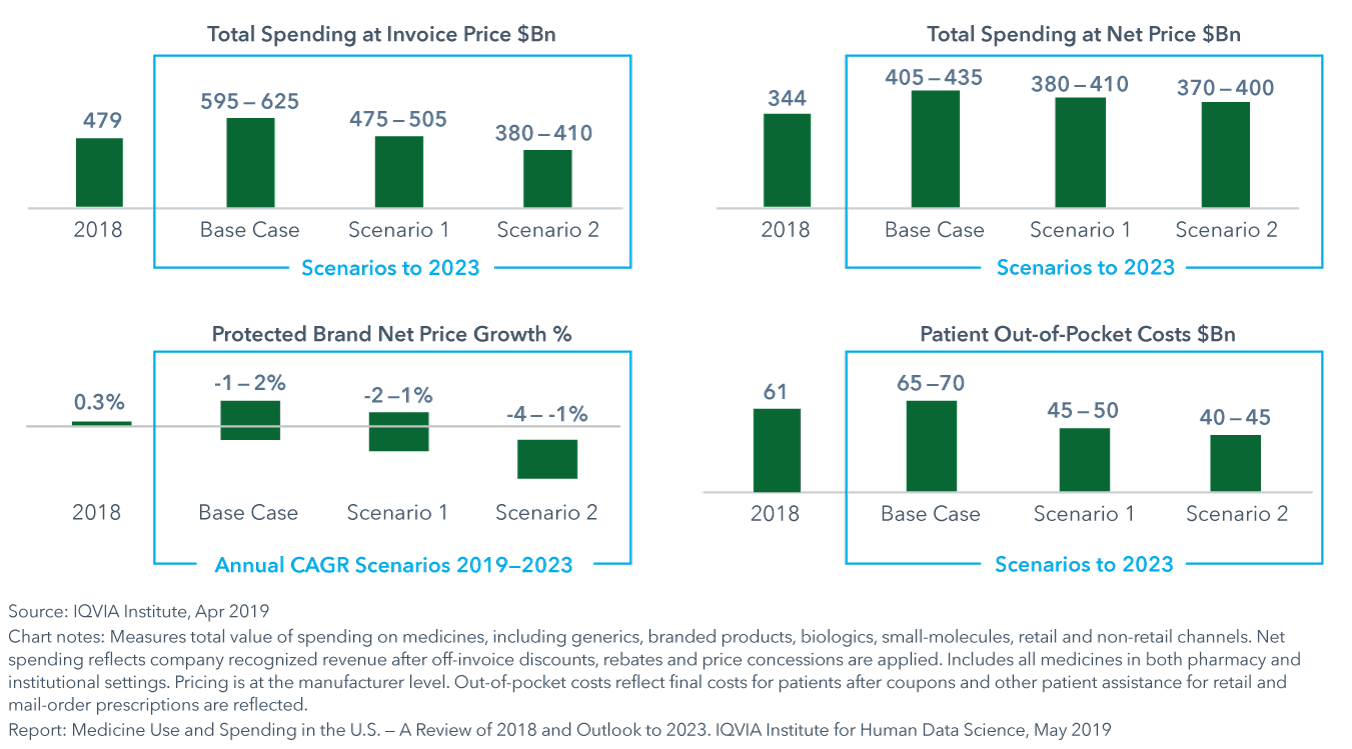
- Potential policy changes could lead to alternative scenarios and impact invoice spending, net spending and out-of-pocket costs in very different ways.
- In one scenario, reforms are limited to Medicare programs, leading to a decline in out-of-pocket costs of $14 billion over the base case and a reduction in net spending by as much as 6%.
- In another scenario, reforms proposed for Medicare would be extended to the commercial market. This could lower out-of-pocket costs 30% and drive net spending 9% lower than base case projections.
Learn More
Webinar
Use of Medicines in the U.S. A Review of 2018 and Outlook to 2023
Access an on-demand webinar where Michael Kleinrock, report author and Institute Research Director, delves deeper into report findings.