


Related Blog
Top Five Insights from the IQVIA Institute 2019 Oncology Trends Report


Developing IQVIA’s positions on key trends in the pharma and life sciences industries, with a focus on EMEA.
Learn more
Developing IQVIA’s positions on key trends in the pharma and life sciences industries, with a focus on EMEA.
Learn more

Developing IQVIA’s positions on key trends in the pharma and life sciences industries, with a focus on EMEA.
Learn more
Developing IQVIA’s positions on key trends in the pharma and life sciences industries, with a focus on EMEA.
Learn more
"We strive to help improve outcomes and create a healthier, more sustainable world for people everywhere.
LEARN MORE
Reimagine clinical development by intelligently connecting data, technology, and analytics to optimize your trials. The result? Faster decision making and reduced risk so you can deliver life-changing therapies faster.
Research & Development Overview
Generate and disseminate evidence that answers crucial clinical, regulatory and commercial questions, enabling you to drive smarter decisions and meet your stakeholder needs with confidence.
REAL WORLD EVIDENCE OVERVIEW
Elevate commercial models with precision and speed using AI-driven analytics and technology that illuminate hidden insights in data.
COMMERCIALIZATION OVERVIEW
Orchestrate your success across the complete compliance lifecycle with best-in-class services and solutions for safety, regulatory, quality and medical information.
COMPLIANCE OVERVIEW
When your destination is a healthier world, making intelligent connections between data, technology, and services is your roadmap.
TECHNOLOGIES OVERVIEWExplore our library of insights, thought leadership, and the latest topics & trends in healthcare.
DISCOVER INSIGHTSAn in-depth exploration of the global healthcare ecosystem with timely research, insightful analysis, and scientific expertise.
SEE LATEST REPORTS
By making intelligent connections between your needs, our capabilities, and the healthcare ecosystem, we can help you be more agile, accelerate results, and improve patient outcomes.
LEARN MORE
Building on a rich history of developing AI for healthcare, IQVIA AI connects the right data, technology, and expertise to address the unique needs of healthcare. It's what we call Healthcare-grade AI.
LEARN MORE
The IQVIA Human Data Science Cloud is our unique capability designed to enable healthcare-grade analytics, tools, and data management solutions to deliver fit-for-purpose global data at scale.
LEARN MORE
The IQVIA Innovation Hub connects start-ups with the extensive IQVIA network of assets, resources, clients, and partners. Together, we can help lead the future of healthcare with the extensive IQVIA network of assets, resources, clients, and partners.
LEARN MORE
IQVIA Decentralized Trials deliver purpose-built clinical services and technologies that engage the right patients wherever they are. Our hybrid and fully virtual solutions have been used more than any others.
LEARN MORE
Empowering patients to personalize their healthcare and connecting them to caregivers has the potential to change the care delivery paradigm. IQVIA and Apple are collaborating to bring this exciting future of personalized care directly to devices patients already have and use.
LEARN MOREOur mission is to accelerate innovation for a healthier world. Together, we can solve customer challenges and improve patient lives.
LEARN MORECareers, culture and everything in between. Find out what’s going on right here, right now.
LEARN MORE
"Improving human health requires brave thinkers who are willing to explore new ideas and build on successes. Unleash your potential with us.
SEARCH JOBSA record number of new oncology drugs has been approved in recent years, bringing new treatment options to patients. However, despite robust levels of pipeline activity, oncology remains a challenging area for research and development. This report examines the productivity and output of the oncology pipeline, new treatment mechanisms, and which patients will likely benefit from new therapies. Our research brings into focus the amount spent on oncology medicines globally, clinical trial activity, complexity and success, and the outlook through 2023. The report also addresses shifts in therapy use with the emergence of immuno-therapies, Next-Generation Biotherapeutics and biosimilars.
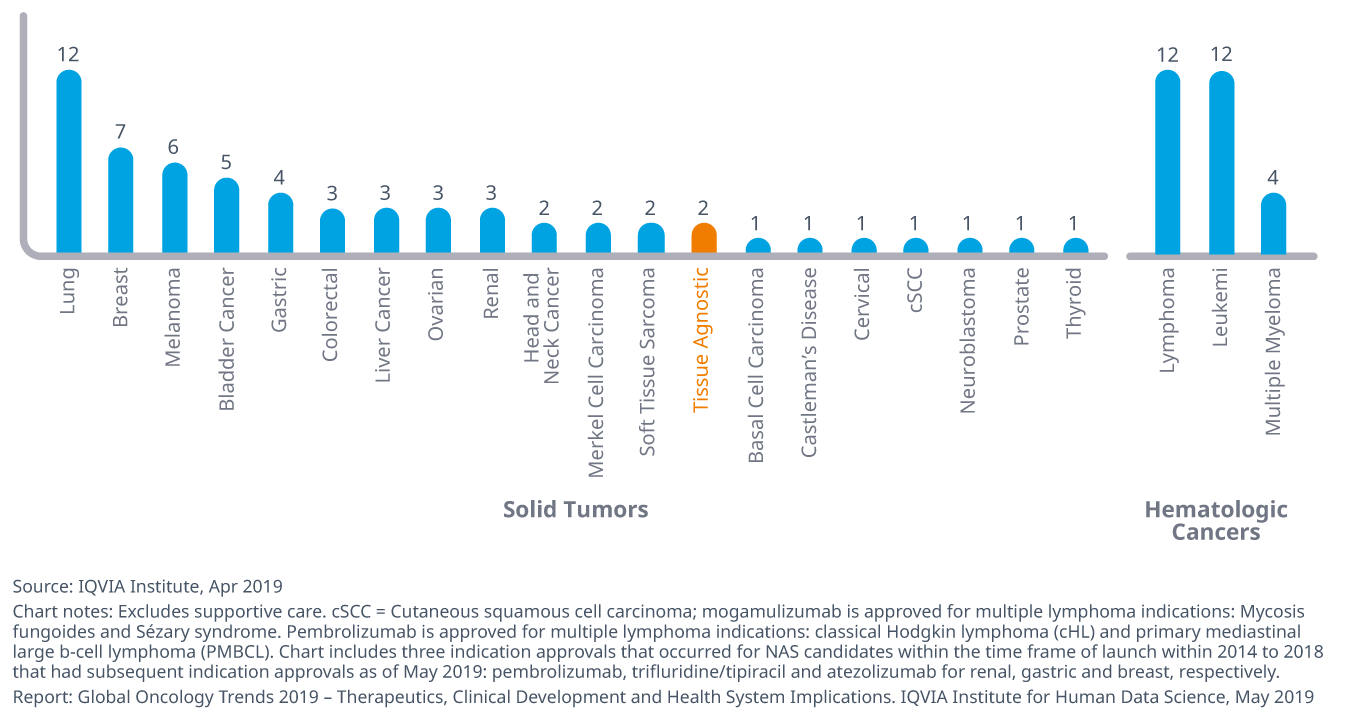
A record 15 new oncology therapeutic drugs were launched in 2018 for 17 indications. Over half of the new therapies are delivered as an oral formulation, have an orphan indication or include a predictive biomarker on their label. Recently introduced therapies are also being used more broadly across varied tumor populations and in earlier lines of therapy. The use of immuno-oncology therapies has doubled in the United States since 2017 and treatment with novel CDK 4/6 inhibitors for HER-2 negative breast cancer has dramatically increased in the United States and Europe.
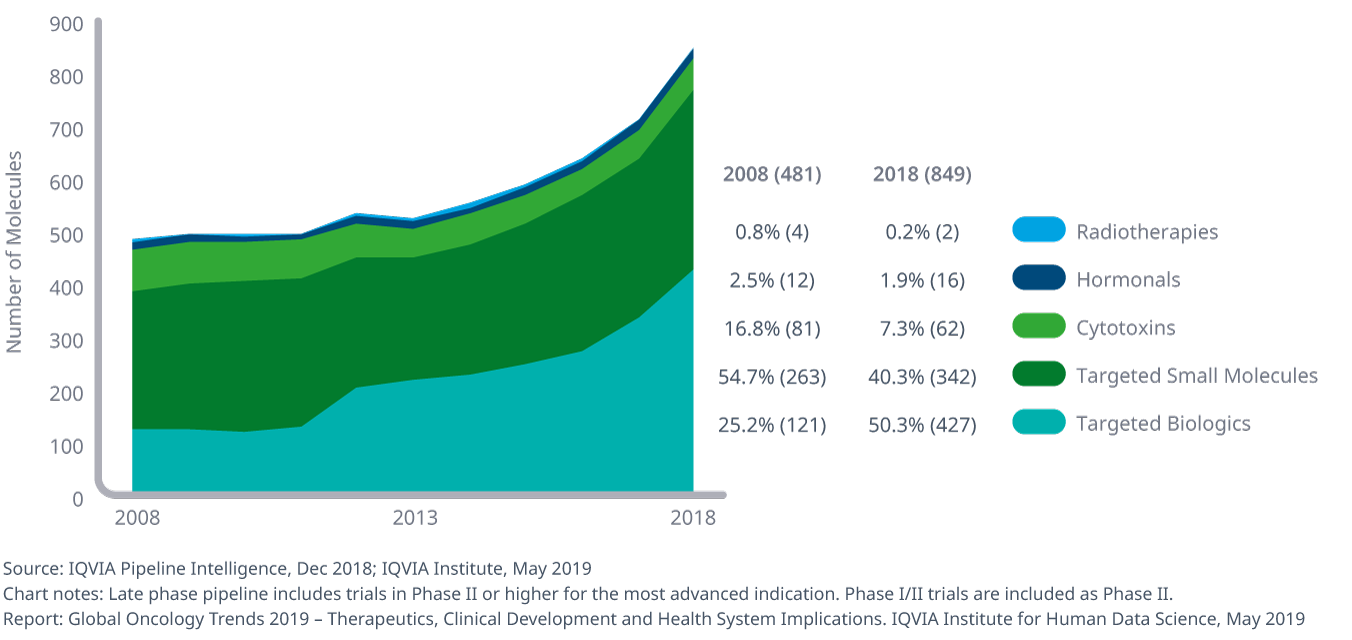
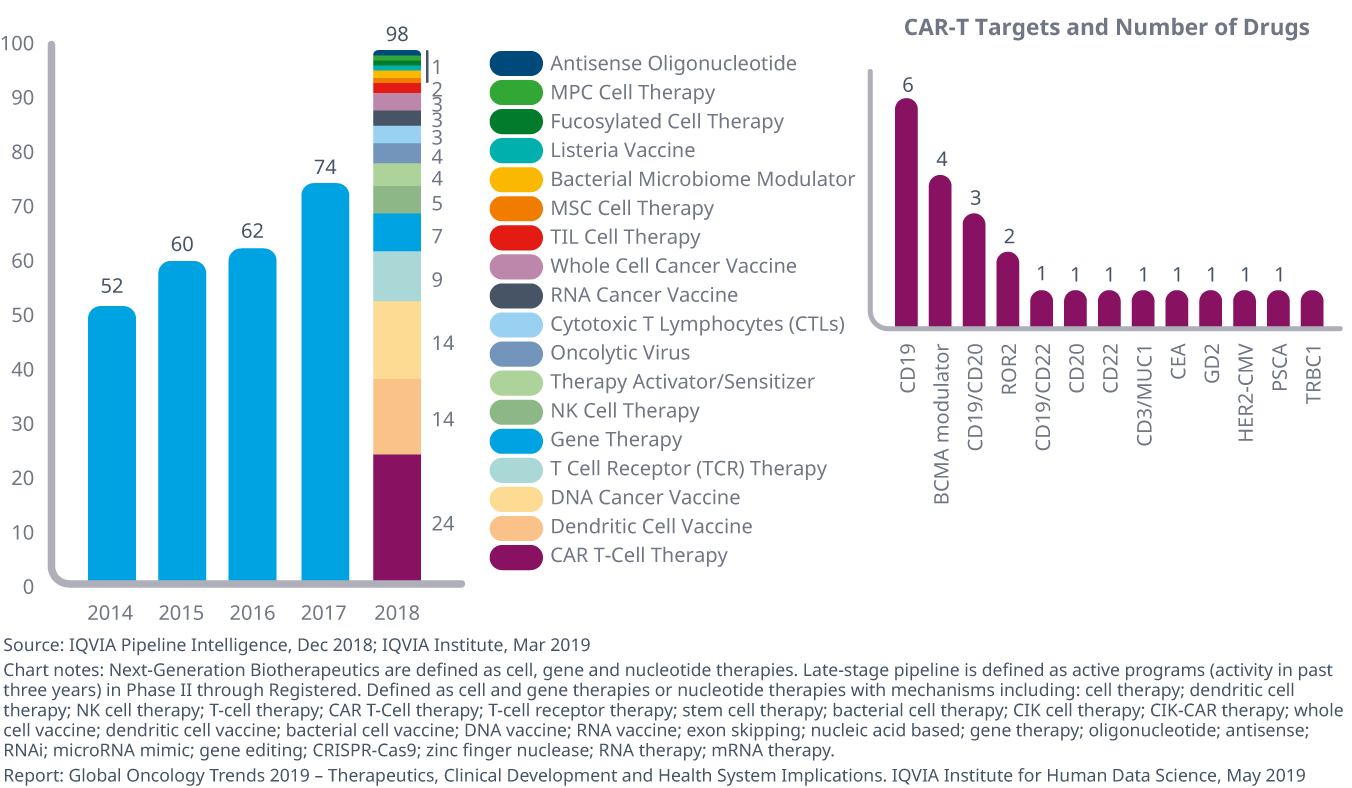
The pipeline of drugs in late-stage development expanded 19% in 2018 alone and 63% since 2013. Within the pipeline and across all phases of clinical development, the most intense activity is focused on nearly 450 immunotherapies with more than 60 different mechanisms of action. Ninety-eight Next-Generation Biotherapeutics – defined as cell, gene and nucleotide therapies - are also under clinical investigation and leverage 18 different approaches.
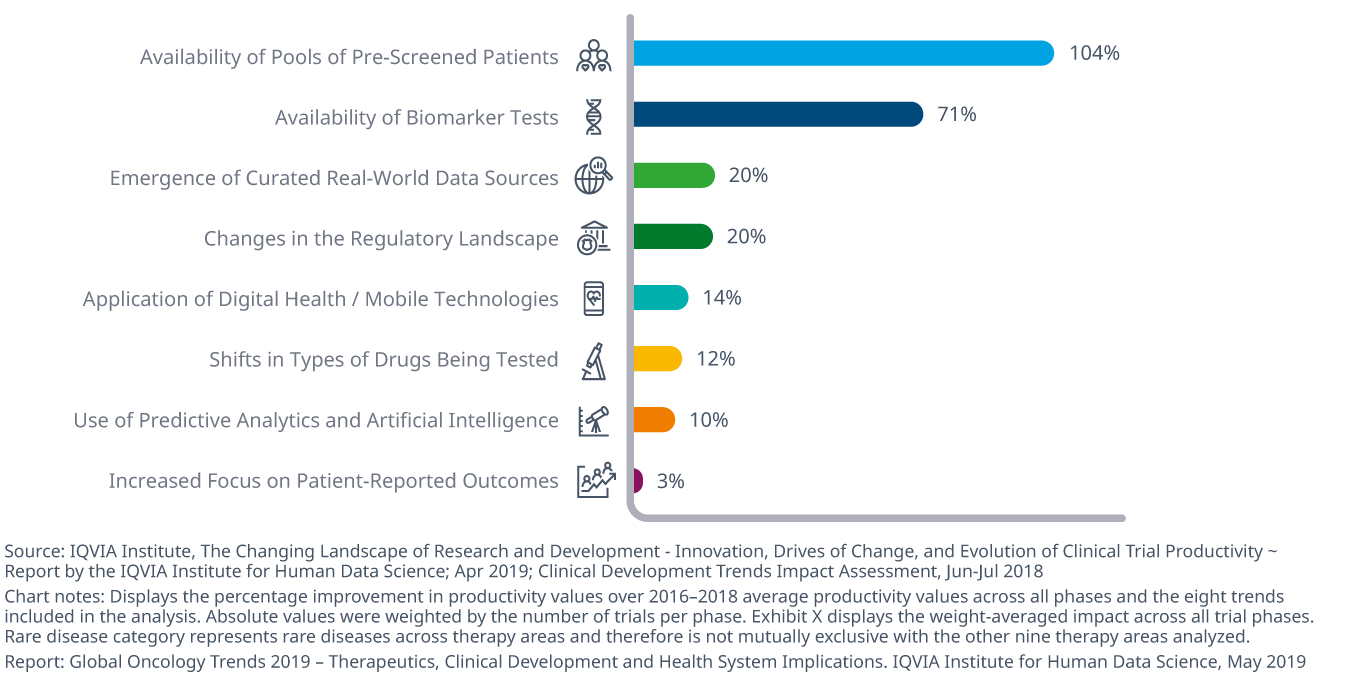
Despite high levels of pipeline activity, oncology remains one of the most challenging areas for research and development, facing significant risk of failure and long development times. The composite success rate for phase transitions fell to 8.0% in 2018 from 11.7% in 2017, and clinical trial duration remains higher for oncology trials than other disease areas. Clinical trial complexity has also increased sharply for phase I oncology trials over the past five years. The overall productivity of oncology trials – measured as success rates relative to trial effort (complexity and duration) – has improved by 22% since 2010 but remains far lower than trials for other therapy areas.
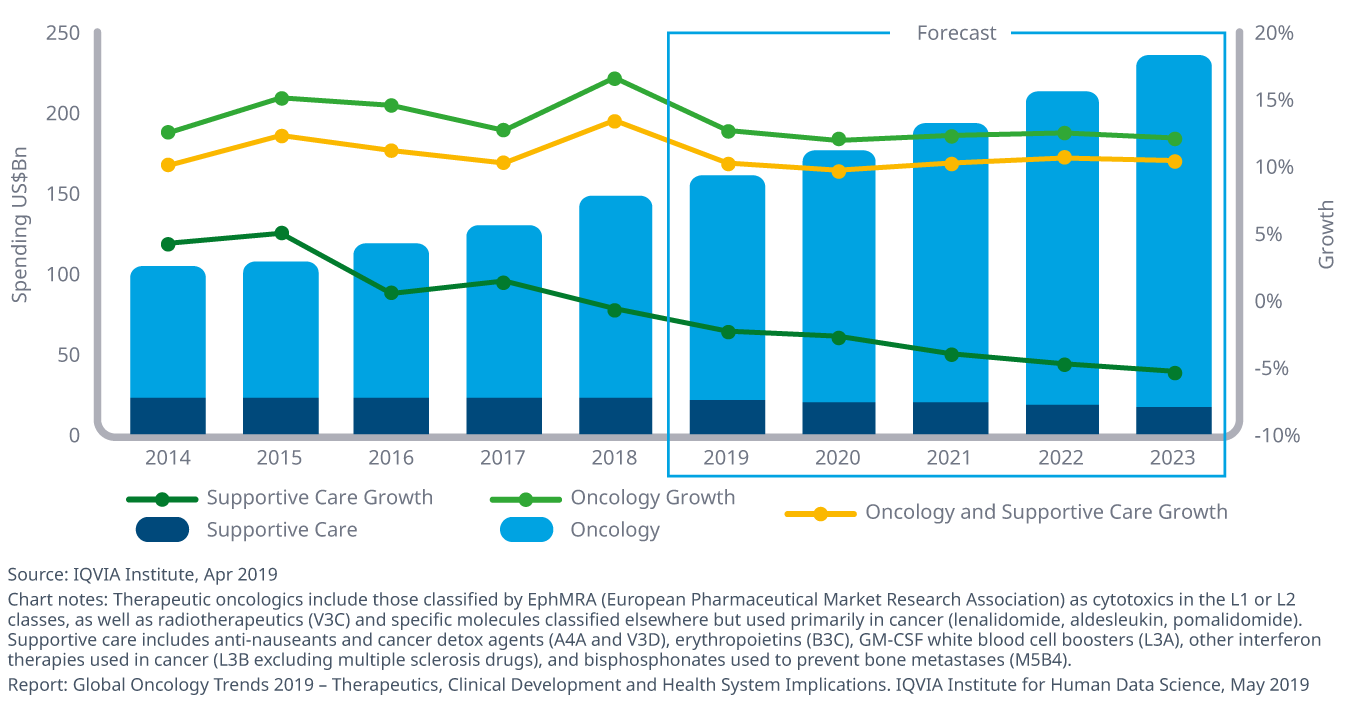
Spending on all medicines used in the treatment of patients with cancer reached nearly $150 billion in 2018 up 12.9% for the year and marking the fifth consecutive year of double-digit growth, driven entirely by therapeutic drugs which grew 15.9%. The average annual cost of new medicines continues to trend upward, although the median cost dropped by $13,000 in 2018 to $149,000, and cost per product ranged between $90,000 and over $300,000. China led pharmerging markets in spending and growth and grew a remarkable 24% in 2018 to $9 billion in total spending, even as supportive care treatments in China declined by 10%. Over the next five years, growth in therapeutics spending of 11–14% is expected on a CAGR basis, bringing the total market to $200–230 billion.
![]()