-
Americas

-
Asia & Oceania

-
A-I
J-Z

EMEA Thought Leadership
Developing IQVIA’s positions on key trends in the pharma and life sciences industries, with a focus on EMEA.
Learn more -
Middle East & Africa

EMEA Thought Leadership
Developing IQVIA’s positions on key trends in the pharma and life sciences industries, with a focus on EMEA.
Learn more
Regions
-
Americas
-
Asia & Oceania
-
Europe
-
Middle East & Africa
-
Americas
-
Asia & Oceania
-

Europe
Europe
- Adriatic
- Belgium
- Bulgaria
- Czech Republic
- Deutschland
- España
- France
- Greece
- Hungary
- Ireland
- Israel
- Italia
EMEA Thought Leadership
Developing IQVIA’s positions on key trends in the pharma and life sciences industries, with a focus on EMEA.
Learn more -
Middle East & Africa
EMEA Thought Leadership
Developing IQVIA’s positions on key trends in the pharma and life sciences industries, with a focus on EMEA.
Learn more
SOLUTIONS
-
Research & Development
-
Real World Evidence
-
Commercialization
-
Safety & Regulatory Compliance
-
Technologies
LIFE SCIENCE SEGMENTS
HEALTHCARE SEGMENTS
- Information Partner Services
- Financial Institutions
- Public Health and Government
- Patient Associations
- Payers
- Providers
THERAPEUTIC AREAS
- Cardiovascular
- Cell and Gene Therapy
- Central Nervous System
- GI & Hepatology
- Infectious Diseases and Vaccines
- Oncology
- Pediatrics
- Rare Diseases
- View All

Impacting People's Lives
"We strive to help improve outcomes and create a healthier, more sustainable world for people everywhere.
LEARN MORE
Harness the power to transform clinical development
Reimagine clinical development by intelligently connecting data, technology, and analytics to optimize your trials. The result? Faster decision making and reduced risk so you can deliver life-changing therapies faster.
Research & Development OverviewResearch & Development Quick Links

Real World Evidence. Real Confidence. Real Results.
Generate and disseminate evidence that answers crucial clinical, regulatory and commercial questions, enabling you to drive smarter decisions and meet your stakeholder needs with confidence.
REAL WORLD EVIDENCE OVERVIEWReal World Evidence Quick Links

See markets more clearly. Opportunities more often.
Elevate commercial models with precision and speed using AI-driven analytics and technology that illuminate hidden insights in data.
COMMERCIALIZATION OVERVIEWCommercialization Quick Links

Service driven. Tech-enabled. Integrated compliance.
Orchestrate your success across the complete compliance lifecycle with best-in-class services and solutions for safety, regulatory, quality and medical information.
COMPLIANCE OVERVIEWSafety & Regulatory Compliance Quick Links

Intelligence that transforms life sciences end-to-end.
When your destination is a healthier world, making intelligent connections between data, technology, and services is your roadmap.
TECHNOLOGIES OVERVIEWTechnology Quick Links
CLINICAL PRODUCTS
COMMERCIAL PRODUCTS
COMPLIANCE, SAFETY, REG PRODUCTS

BLOGS, WHITE PAPERS & CASE STUDIES
Explore our library of insights, thought leadership, and the latest topics & trends in healthcare.
DISCOVER INSIGHTSTHE IQVIA INSTITUTE
An in-depth exploration of the global healthcare ecosystem with timely research, insightful analysis, and scientific expertise.
SEE LATEST REPORTS


FEATURED INNOVATIONS
-
IQVIA Connected Intelligence™
-
IQVIA Healthcare-grade AI™
-
Human Data Science Cloud
-
IQVIA Innovation Hub
-
Decentralized Trials
-
Patient Experience powered by Apple
WHO WE ARE
- Our Story
- Our Impact
- Commitment to Public Health
- Code of Conduct
- Environmental Social Governance
- Privacy
- Executive Team
NEWS & RESOURCES


Unlock your potential to drive healthcare forward
By making intelligent connections between your needs, our capabilities, and the healthcare ecosystem, we can help you be more agile, accelerate results, and improve patient outcomes.
LEARN MORE
IQVIA AI is Healthcare-grade AI
Building on a rich history of developing AI for healthcare, IQVIA AI connects the right data, technology, and expertise to address the unique needs of healthcare. It's what we call Healthcare-grade AI.
LEARN MORE
Your healthcare data deserves more than just a cloud.
The IQVIA Human Data Science Cloud is our unique capability designed to enable healthcare-grade analytics, tools, and data management solutions to deliver fit-for-purpose global data at scale.
LEARN MORE
Innovations make an impact when bold ideas meet powerful partnerships
The IQVIA Innovation Hub connects start-ups with the extensive IQVIA network of assets, resources, clients, and partners. Together, we can help lead the future of healthcare with the extensive IQVIA network of assets, resources, clients, and partners.
LEARN MORE
Proven, faster DCT solutions
IQVIA Decentralized Trials deliver purpose-built clinical services and technologies that engage the right patients wherever they are. Our hybrid and fully virtual solutions have been used more than any others.
LEARN MORE
IQVIA Patient Experience Solutions powered by Apple
Empowering patients to personalize their healthcare and connecting them to caregivers has the potential to change the care delivery paradigm. IQVIA and Apple are collaborating to bring this exciting future of personalized care directly to devices patients already have and use.
LEARN MOREWORKING AT IQVIA
Our mission is to accelerate innovation for a healthier world. Together, we can solve customer challenges and improve patient lives.
LEARN MORELIFE AT IQVIA
Careers, culture and everything in between. Find out what’s going on right here, right now.
LEARN MORE
WE’RE HIRING
"Improving human health requires brave thinkers who are willing to explore new ideas and build on successes. Unleash your potential with us.
SEARCH JOBSInstitute Report
Medicines Use and Spending in the U.S.
May 04, 2017
About the Report
In this report we highlight various aspects of the market for medicines in the U.S—spanning aggregate spending, key medicine categories, volumes, patient cost exposure, as well as our outlook to 2021. The report seeks to provide appropriate context and perspective around the complex factors that drive the level of spending on medicines and their role in our healthcare system.
Summary
Spending on medicines totaled $450Bn in 2016, growing at less than half the rate seen in the last two years, based on invoice prices. Net spending was $323Bn, up 4.8% over 2015 levels, after adjusting for estimated rebates and other price concessions by manufacturers. In 2016, fewer than half the new medicines launched than in the prior two years, and this was coupled to a reduced level of spending on new medicines.
The usage of medicines by patients has continued to rise, in part due to many more patients having wider access to insurance and low cost generic medicines. However, a minority of patients still face substantial out-of-pocket costs and experience a dramatically different trend in their spending on medicines than other patients and the system overall.
The outlook for medicine spending through 2021 is for mid-single digit growth driven by further clusters of innovative treatments, offset by a rising impact from brands facing generic or biosimilar competition. Drug manufacturer responses to heightened market competition and scrutiny of drug pricing are expected to result in more modest levels of invoice (and net) price growth in the forecast period.
Key Findings
U.S. Medicines Growth Slowed by Half in 2016 to 4.8% on a Net Basis
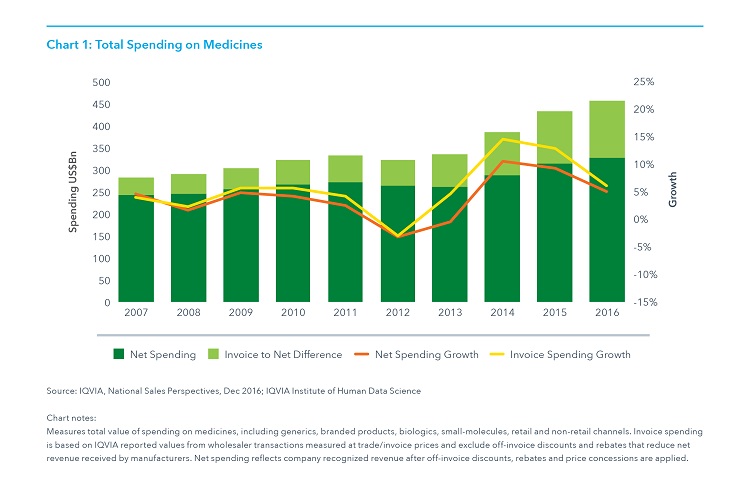
- Spending grew 4.8% net of off-invoice discounts and rebates, as invoice-level growth slowed to 5.8%.
- Discounts, rebates and other price concessions on brands reduced absolute invoice spending by an estimated 28% to $323.1 billion
- Spending growth slowed in 2016 after two historically high years due to lower price increases for protected branded products, fewer new products launched and lower spending growth, specifically for hepatitis C treatments where spending declined in 2016.
- Net price increases averaged 3.5%, significantly lower than invoice price increases which averaged 9.2%, with 62% of growth from price on an invoice basis conceded after estimating net prices.
Real Net Per Capita Drug Spend Has Been Relatively Unchanged Over the Past Decade
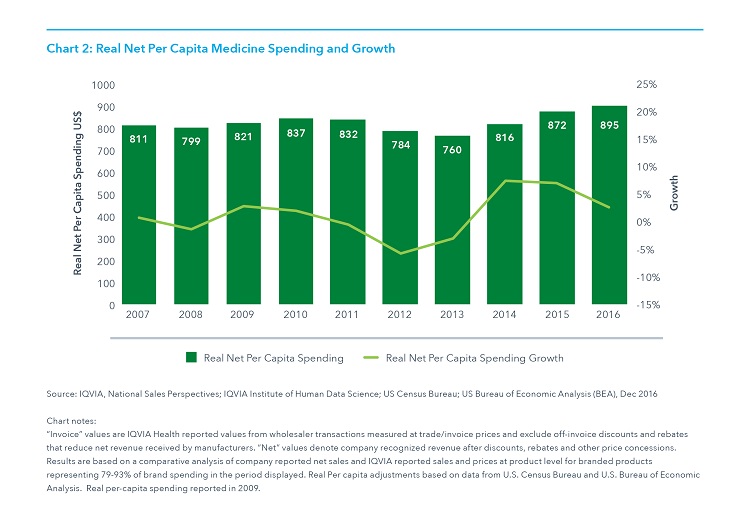
- Medicine spending including both pharmacy and medicines dispensed in hospitals, clinics and other non-retail settings, has increased an average of 1.1% per year since 2006 when it was $805 per person, and has risen only 11% in ten years to $895 in 2016.
- Spending increased 5.8% in 2016 on an invoice basis and 4.8% on a net basis, but after accounting for population, economic growth and estimates of off-invoice concessions by manufacturers, spending increased 2.6% over the prior year.
- While manufacturer net revenues, adjusted in this way, have increased only modestly over the past decade, patient exposure to costs has increased dramatically, more in line with list prices.
Net Prices Continued to Increase More Slowly Than Invoice Prices
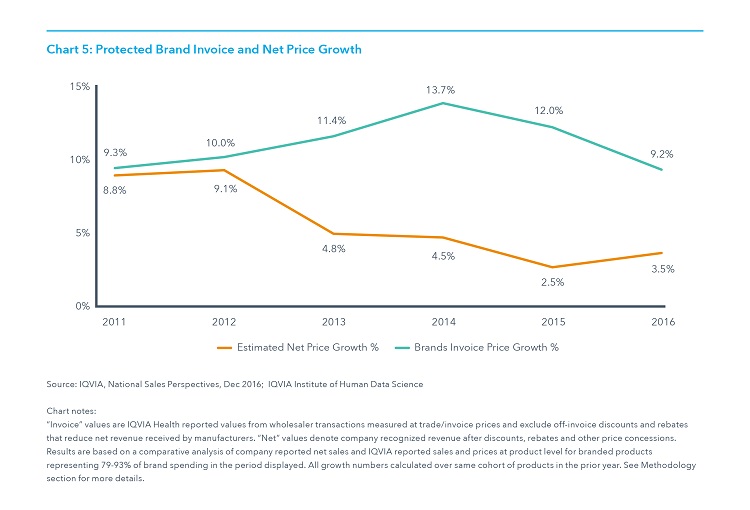
- Price increases for protected brands averaged 9.2% on an invoice-price basis while net price growth is estimated to have increased 3.5% in 2016 on average.
- Net price spending growth was driven by autoimmune, HIV and oncologic therapies while offset by large net price declines in hepatitis, MS and respiratory therapies.
- The increase in average net price growth from 2015 to 2016 reflects changes in the portfolio of large brands in the market and differential levels of price concessions.
- Invoice price increases were lower than prior years on average, but above average increases were observed in many individual markets and had the most impact on invoice-level spending in autoimmune, cholesterol, nervous system disorders (e.g., epilepsy, Parkinson’s), and erectile dysfunction.
Prescription Growth in Younger Patients is Driven by Usage, While Growth in Older Patients is Due to Population
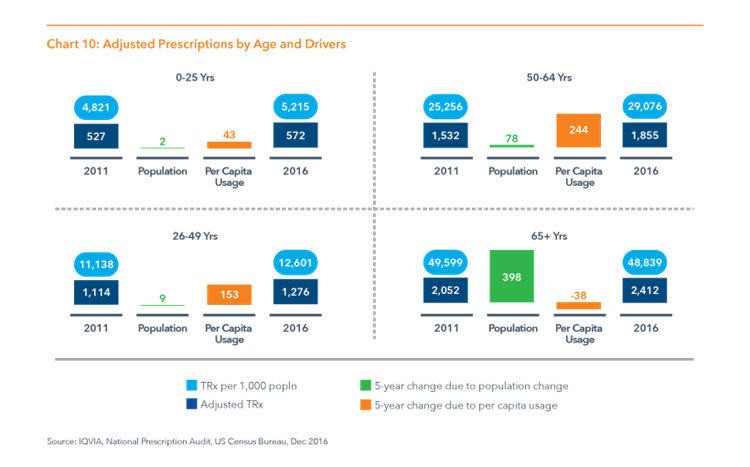
- Patients over 65 had declining per capita usage of prescriptions from 2011 to 2016 while driving most of the population growth in the country as “baby boomers” reached retirement age and many continue to live longer.
- Adults aged 26-64 accounted for 99% of the 402Mn of incremental prescriptions from rising per capita usage, as both groups benefited significantly from Medicaid expansion and insurance exchanges under the ACA.
- Overall, the aging population is driving higher prescription usage. This is mainly occurring through population growth, with patients over 50 accounting for 682Mn of the 884Mn incremental prescriptions over the past five years, 70% of that from a rising share of the population, and 30% from higher usage, all from the 50-64 age group. Patients over 65 had declining usage.
Prescriptions Dispensed at Zero Patient Out-of-Pocket Cost Reached Thirty Percent in 2016
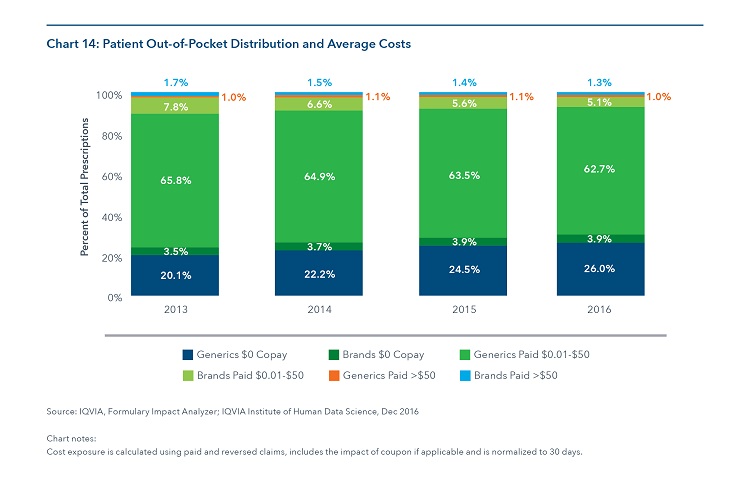
- 29.9% of prescriptions have been dispensed at zero patient out-of-pocket cost, including brands and generics, up 1.5% since 2015, all due to increased use of zero cost generics.
- The total share of prescriptions where patients paid some amount less than $50 declined by 1.3% to 67.8% in 2016.
- The proportion of claims with patient cost exposure greater than $50 increased also declined slightly from 2.5% to 2.3% in 2016.
Since 2013, Average Out-of-Pocket Costs for All Brand and Generic Prescriptions has Decreased by $1.19
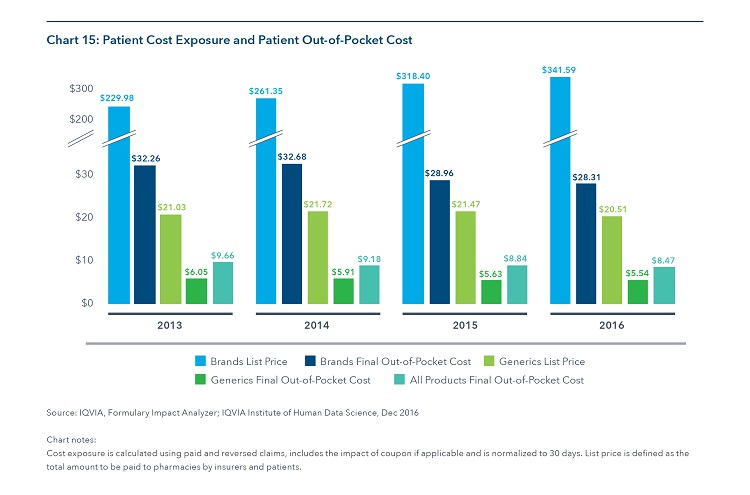
- Average patient out of pocket costs declined from $9.66 in 2013 to $8.47 in 2016, with 2016 brand costs declining to $28.31 from $32.36 in 2013 and generics dipping to $5.54 from a high of $6.05 in 2013.
- The list prices of brands continue to be far higher than the average paid by patients, as few patients are exposed to those costs in their insurance plans.
- The average list price for brands averaged 12 times higher than the average out of pocket cost for patients in 2016 compared to 3 times higher for generics.