-
Americas
-
Asia & Oceania
-
A-I
J-Z

EMEA Thought Leadership
Developing IQVIA’s positions on key trends in the pharma and life sciences industries, with a focus on EMEA.
Learn more -
Middle East & Africa

EMEA Thought Leadership
Developing IQVIA’s positions on key trends in the pharma and life sciences industries, with a focus on EMEA.
Learn more
Regions
-
Americas
-
Asia & Oceania
-
Europe
-
Middle East & Africa
-
Americas
-
Asia & Oceania
-
Europe
Europe
- Adriatic
- Belgium
- Bulgaria
- Czech Republic
- Deutschland
- España
- France
- Greece
- Hungary
- Ireland
- Israel
- Italia

EMEA Thought Leadership
Developing IQVIA’s positions on key trends in the pharma and life sciences industries, with a focus on EMEA.
Learn more -
Middle East & Africa

EMEA Thought Leadership
Developing IQVIA’s positions on key trends in the pharma and life sciences industries, with a focus on EMEA.
Learn more
SOLUTIONS
-
Research & Development
-
Real World Evidence
-
Commercialization
-
Safety & Regulatory Compliance
-
Technologies
LIFE SCIENCE SEGMENTS
HEALTHCARE SEGMENTS
- Information Partner Services
- Financial Institutions
- Public Health and Government
- Patient Associations
- Payers
- Providers
THERAPEUTIC AREAS
- Cardiovascular
- Cell and Gene Therapy
- Central Nervous System
- GI & Hepatology
- Infectious Diseases and Vaccines
- Oncology
- Pediatrics
- Rare Diseases
- View All

Impacting People's Lives
"We strive to help improve outcomes and create a healthier, more sustainable world for people everywhere.
LEARN MORE
Harness the power to transform clinical development
Reimagine clinical development by intelligently connecting data, technology, and analytics to optimize your trials. The result? Faster decision making and reduced risk so you can deliver life-changing therapies faster.
Research & Development OverviewResearch & Development Quick Links

Real World Evidence. Real Confidence. Real Results.
Generate and disseminate evidence that answers crucial clinical, regulatory and commercial questions, enabling you to drive smarter decisions and meet your stakeholder needs with confidence.
REAL WORLD EVIDENCE OVERVIEWReal World Evidence Quick Links

See markets more clearly. Opportunities more often.
Elevate commercial models with precision and speed using AI-driven analytics and technology that illuminate hidden insights in data.
COMMERCIALIZATION OVERVIEWCommercialization Quick Links

Service driven. Tech-enabled. Integrated compliance.
Orchestrate your success across the complete compliance lifecycle with best-in-class services and solutions for safety, regulatory, quality and medical information.
COMPLIANCE OVERVIEWSafety & Regulatory Compliance Quick Links

Intelligence that transforms life sciences end-to-end.
When your destination is a healthier world, making intelligent connections between data, technology, and services is your roadmap.
TECHNOLOGIES OVERVIEWTechnology Quick Links
CLINICAL PRODUCTS
COMMERCIAL PRODUCTS
COMPLIANCE, SAFETY, REG PRODUCTS
BLOGS, WHITE PAPERS & CASE STUDIES
Explore our library of insights, thought leadership, and the latest topics & trends in healthcare.
DISCOVER INSIGHTSTHE IQVIA INSTITUTE
An in-depth exploration of the global healthcare ecosystem with timely research, insightful analysis, and scientific expertise.
SEE LATEST REPORTSFEATURED INNOVATIONS
-
IQVIA Connected Intelligence™
-
IQVIA Healthcare-grade AI™
-
Human Data Science Cloud
-
IQVIA Innovation Hub
-
Decentralized Trials
-
Patient Experience powered by Apple
WHO WE ARE
- Our Story
- Our Impact
- Commitment to Public Health
- Code of Conduct
- Environmental Social Governance
- Privacy
- Executive Team
NEWS & RESOURCES

Unlock your potential to drive healthcare forward
By making intelligent connections between your needs, our capabilities, and the healthcare ecosystem, we can help you be more agile, accelerate results, and improve patient outcomes.
LEARN MORE
IQVIA AI is Healthcare-grade AI
Building on a rich history of developing AI for healthcare, IQVIA AI connects the right data, technology, and expertise to address the unique needs of healthcare. It's what we call Healthcare-grade AI.
LEARN MORE
Your healthcare data deserves more than just a cloud.
The IQVIA Human Data Science Cloud is our unique capability designed to enable healthcare-grade analytics, tools, and data management solutions to deliver fit-for-purpose global data at scale.
LEARN MORE
Innovations make an impact when bold ideas meet powerful partnerships
The IQVIA Innovation Hub connects start-ups with the extensive IQVIA network of assets, resources, clients, and partners. Together, we can help lead the future of healthcare with the extensive IQVIA network of assets, resources, clients, and partners.
LEARN MORE
Proven, faster DCT solutions
IQVIA Decentralized Trials deliver purpose-built clinical services and technologies that engage the right patients wherever they are. Our hybrid and fully virtual solutions have been used more than any others.
LEARN MORE
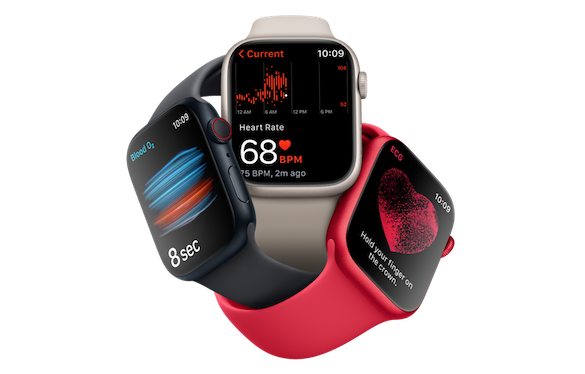
IQVIA Patient Experience Solutions powered by Apple
Empowering patients to personalize their healthcare and connecting them to caregivers has the potential to change the care delivery paradigm. IQVIA and Apple are collaborating to bring this exciting future of personalized care directly to devices patients already have and use.
LEARN MOREWORKING AT IQVIA
Our mission is to accelerate innovation for a healthier world. Together, we can solve customer challenges and improve patient lives.
LEARN MORELIFE AT IQVIA
Careers, culture and everything in between. Find out what’s going on right here, right now.
LEARN MORE
WE’RE HIRING
"Improving human health requires brave thinkers who are willing to explore new ideas and build on successes. Unleash your potential with us.
SEARCH JOBS- Insights
- The IQVIA Institute
- Reports and Publications
- Reports
- Medicine Use and Spending in the US Review of 2017 Outlook to 2022
About the Report
Spending on medicines remains a topic of intense interest among policy makers, patients, payers and drug manufacturers. This report focuses its attention on “net spending” on medicines in the United States in 2017 with an outlook to 2022, explores out-of-pocket patient costs at pharmacies and examines the overall volume of medicines being used, with a special focus of opioids and newly launched, innovative medicines.
Report Summary
The level and growth of spending, the price of new and old drugs, and the allocation of costs among patients, employers, health plans, intermediaries and state and federal government agencies all command great attention. The goal of this report is to provide objective measures of medicine use and their cost to our healthcare system.
Spending on medicines grew by 0.6% in 2017 after off-invoice discounts and rebates. This spending includes all types of medicines, including institutional use for inpatients and outpatients. Focusing only on retail and mail-order pharmacy distribution, net spending declined by 2.1%.
When adjusted for manufacturer discounts and rebates, as well as economic and population growth, medicine spending declined, on a per capita basis, by 2.2% in 2017 and has increased by an average of 1.0% per year since 2008. The balance of medicine spending has shifted strongly to specialty medicines from traditional treatments.
Medicine use by patients has continued to rise. In 2017, there was a significant increase in chronic, 90-day prescriptions which can be linked to efforts to improve adherence. Of note, the greatest decline in treatment volumes in 2017 was for prescription opioids; the highest doses of prescription opioids declined by over 33% during the past two years.
Pharmacy prices for brand prescriptions increased by 58% over the past five years, while final out-of-pocket costs for all prescriptions declined by 17%. These divergent trends reflect the complex dynamics determining how much patients pay for their medicines and the influence those costs have on whether they fill their prescriptions.
New drug launches more than doubled in 2017 from 2016. Forty-two new active substances (NAS) were launched, with 21 for rare diseases and 14 in cancer. Significant shifts in the regulatory process are becoming apparent, as 19 drugs received a breakthrough designation and 18 included patient-reported outcomes as part of their approved label from FDA.
The outlook to 2022 is for 2–5% net spending growth, with 1–4% growth in retail and mail-order prescription drugs. This growth, driven primarily by the large number of new medicines, many of which will be specialty and orphan drugs, will be offset by the impact of losses of brand exclusivity.
Key Findings
Learn More
On-Demand Webinar Available Now
Join author and IQVIA Institute Research Director, Michael Kleinrock, as he provides objective context and perspective around the complex factors that determine the level of spending on medicines in the U.S. and their impact on policy makers, patients, payers and drug manufacturers.
Report Infographic
Explore trends and highlights from each of the five chapters of the report.


